If you’re creating videos for social media, you need to dig past surface-level numbers.
Views and likes? Helpful, but they only scratch the surface.
In this post, we’ll break down the social video metrics that matter most, share expert-backed tips to boost performance, and show how social media analytics tools make tracking easy.
Key takeaways
- Social video metrics tell you what’s working so you can make smarter calls about what to create next.
- The most important video metrics include average watch time, shares, saves, view count, and conversion rate.
- Social algorithms reward videos that hold attention. The longer people watch, save, and rewatch, the farther it travels.
- Native platform tools are great for going deep on a single channel, but tools like Hootsuite Analytics make it easier to track and compare metrics across every platform from one dashboard.
Social video metrics are the numbers that show how your video content performs on social media platforms. They track how often your videos are watched, how people interact with them, and what actions viewers take after watching.
At their best, video metrics don’t just tell you what happened, they show you why. These are the insights that help shape smarter content, better social media campaigns, and a stronger connection with your target audience.
Some examples of social video metrics include:
- View count: How many times your video was played.
- Watch time: How long people stayed engaged.
- Engagement rate: How often viewers interacted (likes, comments, shares).
- Video completion rate: How many viewers watched all the way through.
- Click-through rate (CTR): How often viewers clicked on your call-to-action (CTA).
- Shares and saves: Indicators of content that resonates and drives social sharing.
Bonus: Get a free social media analytics report template that shows you the most important metrics to track for each network.
Why do social video metrics matter?
Social video metrics matter because they’re how you measure the actual impact of your video strategy.
Here’s what they help you do:
- Understand what’s working (and what’s not)
- Prove return on investment (ROI) and secure buy-in
- Refine your creative and messaging
- Compare and benchmark across social channels
Here are the top social video metrics that can tell you the most about your performance across all channels.
1. View count
View count tells you how many times your video has been watched. But don’t let that simplicity fool you. Views are still one of the most important video metrics, especially for measuring brand awareness and reach.
Every platform defines a “view” differently, so context matters.
Here’s what counts as a view by platform:
- Facebook:
- Reel: The moment the video starts playing
- In-feed video: 3 seconds or more
- Instagram:
- Reel: The moment the video starts playing (including replays)
- In-feed video: 3 seconds or more
- YouTube:
- Video: 30 seconds or more
- Shorts: The moment your video starts playing. Note: this means even if a user scrolls past, it counts as a view as long as the video begins to play.
- TikTok: 1 second (or 3 seconds for videos 3 minutes and longer)
- LinkedIn: 2 seconds or more, with at least 50% of the video on screen
- X (Twitter): 2 seconds or more, with at least 50% of the video on screen
- Snapchat: 1 second or more
“From an awareness standpoint, we care about how widely shared the video is to see if this was something the algorithm favored,” says Hootsuite’s Former Social Media Strategist, Eileen Kwok.
Even the platforms themselves are leaning into views. Instagram recently made views the primary metric across all content, not just Reels.
That said, views aren’t always what they seem. Some platforms (like Meta) have been called out for counting any quick scroll-past as a view, which can inflate the numbers without reflecting real engagement. It’s a reminder that view count is a helpful signal, but not the whole story.
If your video views are consistent, you know your videos are regularly reaching people — congrats! You’re in a pretty good position.But if they’re swinging up and down, take a closer look at your top performers to figure out what’s clicking.
2. Engagement rate
Generally, social media engagement describes how your audience interacts with your content. Video engagement includes likes, comments, shares, and saves, and can indicate how much your video resonated with viewers.
People like Instagram’s Head, Adam Mosseri are pretty clear that engagement metrics are among the most important to track.

Source: @mosseri
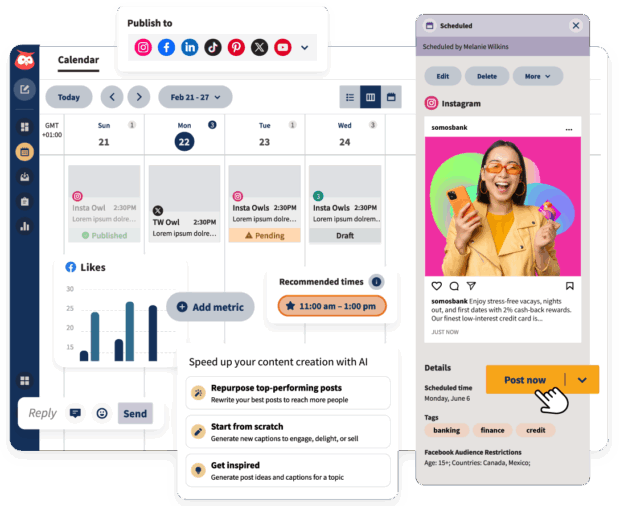
You can review these social media metrics in the platforms themselves, or you can check out even more information in a social media management tool like Hootsuite.
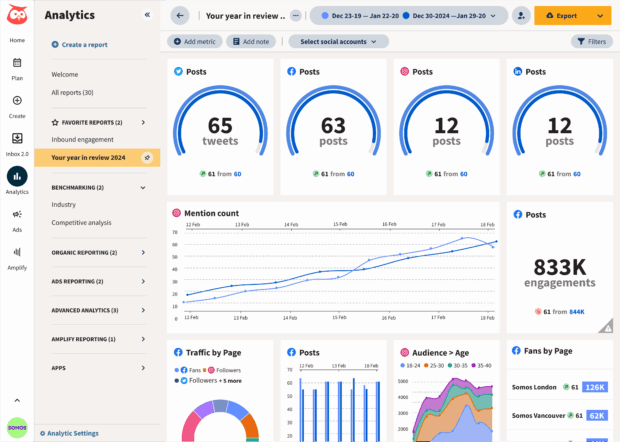
Reviewing your video engagement on its own is useful, but it can be helpful to zoom out a little, too. Check out average engagement rates by industry to see where you stand, or use Hootsuite Analytics to compare your performance to your top competitors.
With Hootsuite’s social media benchmarking, you can find out how others in your industry are doing on social media and compare your results with just a few clicks.
You can also set up custom timeframes, switch between networks — like Instagram, Facebook, X, LinkedIn, and TikTok — and look up benchmarks for metrics like engagement rate, clicks, shares, and more.

And, if you need to present your results to your team or other stakeholders, you can easily download your comparison report as a PDF file.
If your engagement is low, you may need to read up on social video best practices to improve the quality, format, and overall strategy behind your videos.
Turn customer conversations into your next breakthrough product
Request a demo to see how Hootsuite can help your product team discover emerging trends, validate ideas with real customer insights, and bring better products to market faster.
3. Average watch time
Average watch time tells you how long people stick with your video and where you might be losing them.
“It’s one of the clearest signals of content quality and audience interest,” says Kwok, and it can guide everything from how you structure your videos to how long they should be.
“If you post a one-minute video and the average watch time is three seconds, it’s an indicator that the start of your video is missing a hook,” she explains. “If you posted a three-second video and the average watch time is five seconds, that means the user watched the video more than once.”

Most platforms don’t use the exact label “average watch time,” but they do offer related metrics that can give you the same insight. Here’s what to look for:
- Watch time: Total time your video or Reel was played (including replays).
- 3-second views: Number of times a viewer watched for at least 3 seconds.
- 1-minute views: Number of times someone watched to the 1-minute mark.
- Average watch time: The average amount of time people spent watching your reel (watch time divided by initial views).
- Watch time: Total time your reel was played, including replays.
- Views: The number of times your reel started to play or replay.
- Average watch time: The average amount of time spent watching your video per view, measured in seconds.
- Total watch time: The total amount of time a video keeps playing on the screen, including any replays, while it remains visible to the viewer.
- Views at 25%, 50%, 75%: Show how far viewers made it through your video.
- Completions: Tracked when someone watches 97–100% of your video.
- Completion rate: Completions divided by video impressions as a percentage.
Note: LinkedIn’s average and total watch time metrics aren’t available for videos posted before January 6, 2026.
TikTok
- Average watch time: The average amount of time people spent watching your video.
- Video completion percentage: The number of times the video has been watched in full, as a percentage of viewers.
YouTube
- Minutes watched: Total watch time across all views.
- View duration: The average length of each view session.
- View percentage: How much of each video is watched, on average.
4. Follower growth rate
Follower growth measures the total number of new followers you receive within a select time period.
If one of your content strategy goals is to grow your audience or increase brand awareness, then it’s important to keep an eye on this metric after you post a new video.
Pay close attention to the content that appeals to your core audience and results in a rise in subscribers. By catering to their needs, you’ll be able to improve all of your key social video metrics.
5. Shares
Shares are when viewers send your video to another user through DM or share it on their own page or story. And yes, while shares technically fall under engagement, they’re worth tracking as their own video metric.
Shares indicate that your video resonated with the viewer enough for them to share it with someone else. But shares are also an important metric from a consideration standpoint, according to Kwok.
“Shares are a form of word-of-mouth marketing,” she says. “Users are more likely to pay attention to content that’s shared by their peers.”
Plus, Instagram’s been pretty open about the importance of creating shareable content. If your videos are getting more shares, they’re more likely to get priority in the recommendation algorithms.

Source: @mosseri
6. Saves
Saves are one of the strongest engagement signals you can earn on social video. When someone saves your content, they’re telling you it was useful, entertaining, or memorable enough to come back to.
That makes saves a great way to gauge what your audience actually finds valuable. Saving takes more effort than a quick like, which means a save is a bigger vote of confidence in your content.
Plus, platforms like Instagram and TikTok now treat saves as a key ranking signal in their algorithms.
Take a closer look at which Reels, TikToks, Shorts, and other social videos are saved most often. The patterns you spot (educational content, niche tutorials, evergreen tips) can guide what to make more of going forward.
7. Traffic source
Traffic source shows where your views are coming from — like search, feeds, profile visits, or external websites and shares. Knowing the traffic source can tell you where to spend more time and resources distributing your video content.
On YouTube, you’ll see if views came from search, suggested videos, or outside links. TikTok shows how many views came from the For You Page (FYP), your profile, or search.
“This indicates that the keywords used in the video were picked up by the TikTok algorithm, and your video was pushed to a wider audience,” says Kwok.
If you’re seeing strong numbers from external traffic sources, that means your content is reaching beyond your followers. And that’s always a good sign!
8. Conversion rate
Conversion rate shows how many viewers took action after watching your video, whether that’s signing up, downloading, or buying. It’s the ultimate proof that your video content drove real results.
This metric is especially important when your video has a clear call-to-action (CTA). Think landing page videos, product explainers, or paid ads. If you’re asking viewers to do something, you need to know whether they actually followed through.
What counts as a conversion depends on your goal, but it could include:
- Signing up for a webinar or event
- Downloading a resource
- Starting a free trial
- Making a purchase
To calculate conversion rate, divide the number of conversions by the number of video viewers (or clicks, if you’re using a link).

A strong conversion rate means your message hits home. A weak one? Time to revisit your creative, CTA placement, or landing page experience.
Pro tip 💡: Make tracking conversions easy with UTM links. Tools like Hootsuite’s Ow.ly link shortener help you do this seamlessly.
9. Retention (drop-off points)
Retention tells you exactly how long viewers stick with your video, and when they lose interest. Unlike average watch time (which gives you a single number), retention data reveals where viewers start to drop off.
Most platforms offer retention graphs that show:
- When viewers stop watching
- If certain parts of your video get rewatched
- How much of your video gets viewed on average
Knowing where drop-offs happen helps you answer the questions that actually shape your content:
- Is your hook strong enough?
- Is your pacing right?
- Is your CTA too late?
This metric is especially important on platforms like Instagram, where seconds watched now carry significant weight.
Mosseri has confirmed that the algorithm pays close attention to total seconds viewed, not just completion percentage.
His logic: “We don’t want to penalize longer videos, which is why we look at not only the percentage of a video that was watched, but also the number of seconds. If you watched 10 seconds of a minute long video, that is just as many seconds as if it was 10 seconds of a 10 second video, so you won’t be penalized.”
Translation: both completion rate and total seconds watched matter. Even if viewers don’t make it to the end, watching a chunk of a longer video still sends a positive signal to the algorithm.
The video metrics you should track depend entirely on your goals. For example, what you’d measure for a brand awareness campaign looks completely different from what you’d measure for a community-building one.
Here’s a quick guide to which metrics to track based on your goal:
| If your goal is… | Track these video metrics |
| Brand awareness | Views, impressions, reach |
| Engagement | Engagement rate, comments, shares, saves |
| Audience retention | Average watch time, retention, completion rate |
| Conversion and ROI | Conversion rate, click-through rate, traffic source |
| Community building | Comments, replies, saves, shares |
Our advice? Pick two or three KPIs that align with your goal, and don’t get distracted by the rest.
Improving your social video metrics comes down to understanding your audience and tweaking your strategy based on how they respond.
To get insider tips on what works, I asked Mariam (MJ) Ordubadi, Head of Marketing at Aequilibrium, for strategies to increase views, engagement, and retention.
Here are her top five tips:
- Treat the first 3 seconds like prime real estate
- Match length to platform psychology
- Obsess over retention, not just views
- Build “loopability” into your DNA
- Use AI creatively to drive results
1. Treat the first 3 seconds like prime real estate
Your video isn’t just competing with other content, it’s fighting against the scroll reflex, which is why Ordubadi’s team obsesses over hooks. As she puts it: “The first few seconds are make-or-break.”
One of her most reliable formulas? “The problem/solution hook: ‘Don’t have time to make dinner but need to finish your groceries? This hack will save you time and food rot.’ It works because it’s specific, urgent, and promises immediate value.”
But she warns against clickbait: “The key is to stop the scroll without misleading your audience.”
Try this: Run your first 5 seconds through the “mute test.” If the visual alone doesn’t make someone unmute the video, it might be time to rework it.
2. Match length to platform psychology
Ordubadi’s team constantly analyzes how video length affects performance, and the takeaway is clear: there’s no universal “right” length, only the right length for the platform and goal.
“For TikTok, Reels, and Shorts, under 30 seconds still dominates for discovery,” she notes, “But when the goal is education or conversion, we’ve had success with 2 to 3 minute videos on LinkedIn and YouTube, as long as every second delivers value.”
Her guiding principle? “I follow the ‘as short as possible, as long as necessary’ rule. No one wants to sit through fluff.”
The data backs this up: “Audience retention drops significantly after the 60-second mark unless your storytelling is really strong — so editing for pacing is just as important as length.”
Try this: Use YouTube’s retention graphs to identify “dead zones.” If 40% of viewers drop at 0:45, either cut that section or add a visual hook at 0:40 to pull them back in.
3. Obsess over retention, not just views
Retention tells you whether your content is actually landing. Which is why Ordubadi is more focused on what happens after the click.
“While view count is an attractive metric, I care more about average watch time and retention rate,” she explains. “These tell me if the content is actually resonating.”
A view just shows that someone saw your video, maybe for a split second. Retention shows who stuck around, and for how long. “I want to know what’s catching the audience’s attention and what makes them bounce.”
That said, engagement rate still matters: “I also note engagement rate — likes, comments, shares — to assess the overall community impact.”
Try this: Compare retention graphs across your last 5 videos. Look for patterns in the intros, pacing, or visuals that kept people watching. Then, repeat what works.
4. Build “loopability” into your DNA
Some of Ordubadi’s biggest performance gains have come from a single insight: creating content with repeat viewing in mind.
“Scripting for ‘loopable moments’ has transformed my approach,” she says. “These are short videos that can be watched multiple times to fully grasp the message.”
Loopable content is especially effective with content like Instagram Reels and TikTok, where replay culture is baked into how people consume content.
“We saw this trend take off with brands like Duolingo, where looping drives higher watch time and retention,” she notes.
It also opens the door to layered storytelling. Think: pop culture nods, visual Easter eggs, or inside jokes meant for those “who are chronically online.”
Try this: Add one “rewatch trigger” (a blink-and-you-miss-it detail) in your next 5 videos and compare retention rates.
5. Use AI creatively to drive results
Ordubadi is closely watching the rise of AI-native video formats.
“There are these ‘talking document’ formats I’ve seen,” she explains, “where a creator is breaking down a Google Sheet in real time with their face as a bubble in the corner.”
Her team is testing this style by repurposing internal strategy docs into social-friendly video explainers. “It’s performing particularly well on platforms where B2B audiences are looking for clarity and authenticity.”
More broadly, Ordubadi sees AI-powered content as a rising force in education and thought leadership: “There’s a huge wave in AI training hitting the scene from VR to social media — I see it as the next wave of educational content.”
Try this: Turn a behind-the-scenes doc, deck, or tool into a short, face-on video walkthrough. The key is blending value with relatability to earn trust, especially with professional audiences.
Once you know which social video metrics to track, the next step is simple: make sure you actually track them.
Here are three tools to help you stay on top of your social media video performance.
1. Social media analytics report template
If you’re serious about tracking performance across platforms, you need a clear, repeatable way to report on it. That’s exactly what Hootsuite’s free social media analytics report template is designed for.
This isn’t just a spreadsheet. It’s a simple yet powerful way to:
- Capture all your key metrics (like view count, engagement rate, and conversion rate) in one place
- Compare performance across different platforms and time periods
- Turn raw numbers into insights you can present to your team or clients
One of the biggest challenges with social video is staying consistent in how you report. This template makes it easy.
You’ll quickly spot patterns, identify which type of videos are resonating, and refine your video marketing strategy without getting lost in spreadsheets or scattered platform dashboards.
2. Hootsuite Analytics
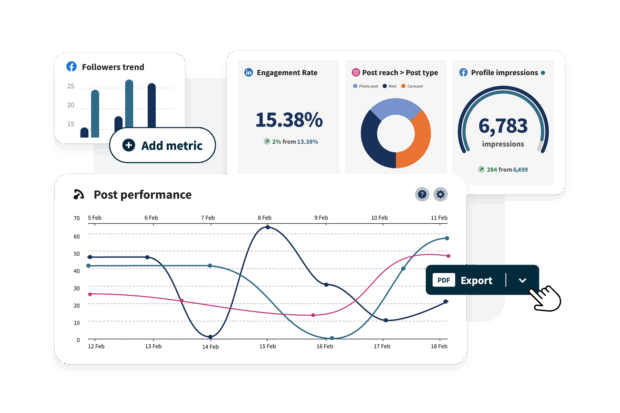
While templates are great for structure, nothing beats a live dashboard when it comes to day-to-day tracking.
Hootsuite Analytics brings all your video metrics together across platforms, so you can:
- Monitor performance in real time
- Benchmark against competitors with industry data
- Drill into details like retention, CTR, and shares— without hopping between apps
Plus, you can generate presentation-ready reports in just a few clicks (perfect for stakeholder updates or proving ROI fast).
Whether you’re analyzing Instagram Reels, LinkedIn videos, or TikToks, Hootsuite Analytics makes cross-channel reporting easy and actionable.
3. Native platform tools
Native platform tools are the built-in analytics dashboards each social network offers, and they’re often the most granular source of data you can get. They’re also where new features and metrics tend to show up first.
Here’s what you can typically access on each platform:
- YouTube Analytics: Detailed watch time, retention, traffic sources
- Instagram Insights: Views, engagement, saves, shares, retention
- TikTok Analytics: Views, average watch time, traffic sources, play rate
- LinkedIn Analytics: Views at key milestones (25%, 50%, 75%, complete), average watch time, total watch time, engagement
- Facebook Insights: Video views, retention, reactions, shares
- X Analytics: Video views, engagement, impressions
While platform tools are useful, they can quickly become overwhelming if you’re managing multiple channels. That’s where templates and dashboards (like Hootsuite) can help you zoom out and see the big picture.
FAQ: Social video metrics
What are the most important social video metrics for businesses?
What is a good video engagement rate across social platforms?
How do video metrics differ across TikTok, Instagram, and YouTube?
How do brands measure ROI from social video content?
Social video views vs watch time: which metric matters more?
Ready to put your video marketing plan into action? Upload, schedule, publish, promote, and monitor your social videos from one platform — Hootsuite makes it easy.