So you’ve planned and launched a social media campaign, and waited patiently for the likes, comments, and conversions to roll in. Now you’re looking at your performance report, wondering what the numbers actually mean. Is a 2% engagement rate high or low? Did your target audience love your campaign, or was it a flop?
Without social media benchmarks (a.k.a. average performance stats for a social platform or industry), it’s difficult to make sense of raw data. But we got you. In this post, we’ve rounded up average social media engagement rates from 12 top industries to give you a better understanding of where you stand. (And empower you to brag to your boss with data-informed confidence — you’re welcome.)
We’ve even included a simple (and free!) engagement rate calculator you can use to quickly double-check your own performance stats.
Average engagement rates (January 2025)
Below, you’ll find the latest average engagement rates (per post), broken down by industry and social network.
For more benchmarks (including impressions, audience growth rate, posting frequency, and much more) and insights that will help you improve your marketing strategy, start a free 30-day Hootsuite trial and browse stats from your industry — and hand-picked competitors — in Hootsuite Analytics.

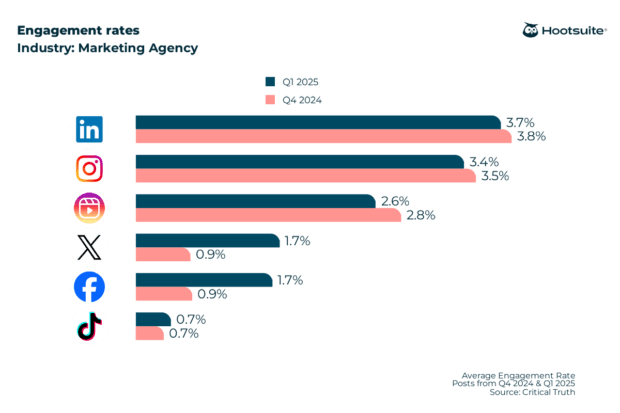
Agencies
- Average LinkedIn engagement rate: 3.7%
- Average Instagram engagement rate: 3.4%
- Average Instagram Reels engagement rate: 2.6%
- Average X (Twitter) engagement rate: 1.7%
- Average Facebook engagement rate: 1.7%
- Average TikTok engagement rate: 0.7%
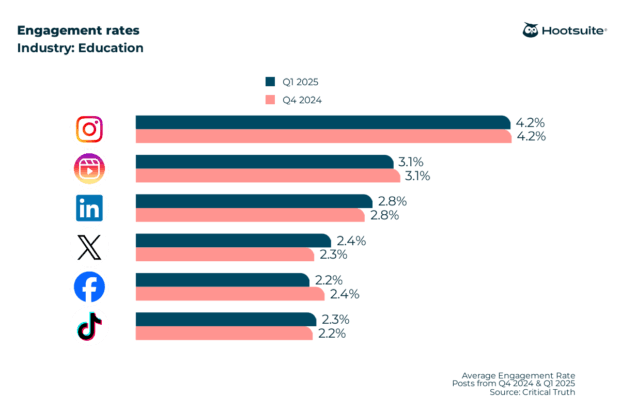
Education
- Average LinkedIn engagement rate: 2.8%
- Average Instagram engagement rate: 4.2%
- Average Instagram Reels engagement rate: 3.1%
- Average X (Twitter) engagement rate: 2.4%
- Average Facebook engagement rate: 2.2%
- Average TikTok engagement rate: 2.3%
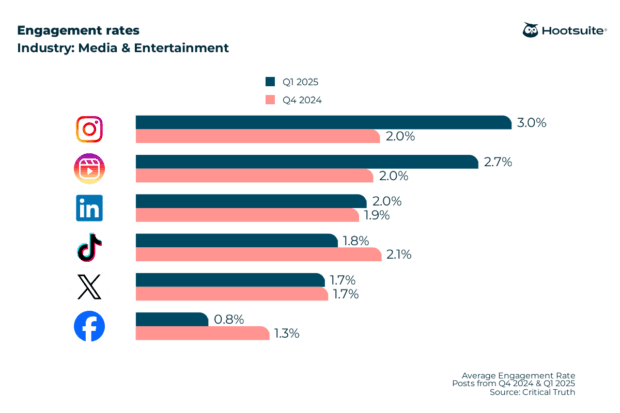
Media and Entertainment
- Average LinkedIn engagement rate: 2.0%
- Average Instagram engagement rate: 3.0%
- Average Instagram Reels engagement rate: 2.7%
- Average X (Twitter) engagement rate: 1.7%
- Average Facebook engagement rate: 0.8%
- Average TikTok engagement rate: 1.8%
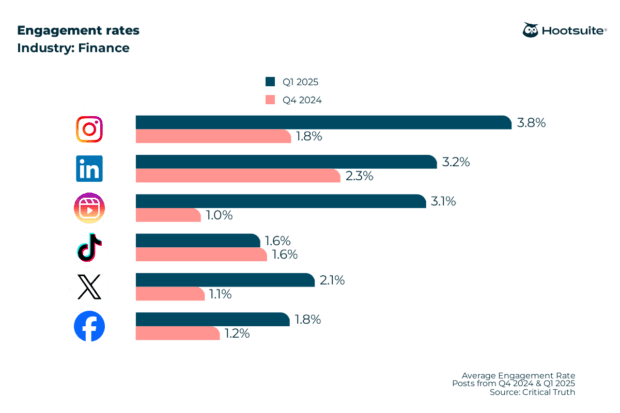
Financial services
- Average LinkedIn engagement rate: 3.2%
- Average Instagram engagement rate: 3.8%
- Average Instagram Reels engagement rate: 3.1%
- Average X (Twitter) engagement rate: 2.1%
- Average Facebook engagement rate: 1.8%
- Average TikTok engagement rate: 1.6%
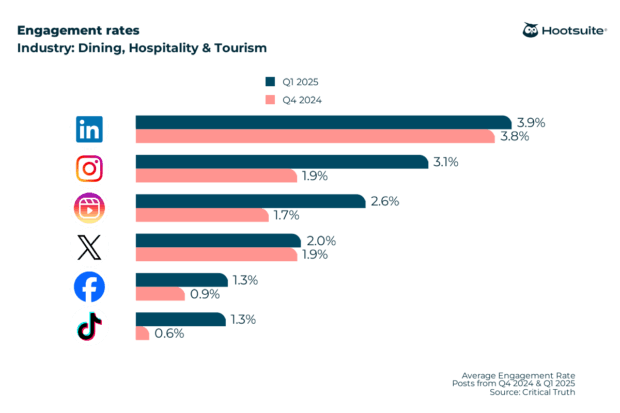
Dining, Hospitality, and Tourism
- Average LinkedIn engagement rate: 3.9%
- Average Instagram engagement rate: 3.1%
- Average Instagram Reels engagement rate: 2.6%
- Average X (Twitter) engagement rate: 2.0%
- Average Facebook engagement rate: 1.3%
- Average TikTok engagement rate: 1.3%
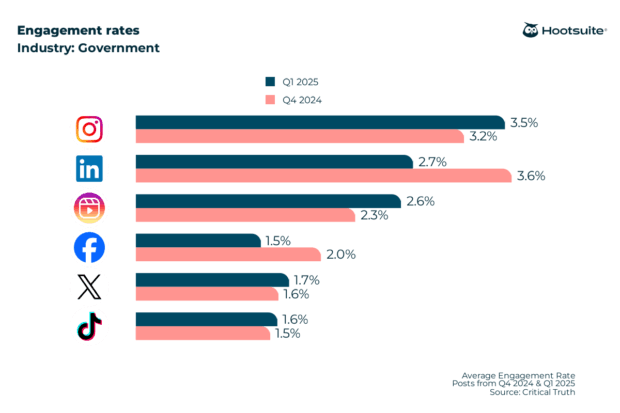
Government
- Average LinkedIn engagement rate: 2.7%
- Average Instagram engagement rate: 3.5%
- Average Instagram Reels engagement rate: 2.6%
- Average X (Twitter) engagement rate: 1.7%
- Average Facebook engagement rate: 1.5%
- Average TikTok engagement rate: 1.6%
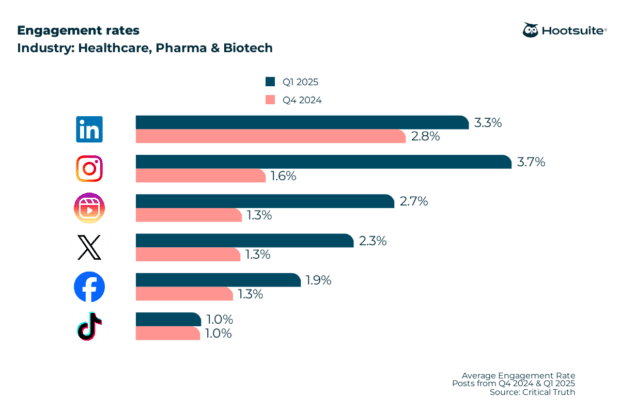
Healthcare, Pharma and Biotech
- Average LinkedIn engagement rate: 3.3%
- Average Instagram engagement rate: 3.7%
- Average Instagram Reels engagement rate: 2.7%
- Average X (Twitter) engagement rate: 2.3%
- Average Facebook engagement rate: 1.9%
- Average TikTok engagement rate: 1.0%
See more social media analytics in healthcare.
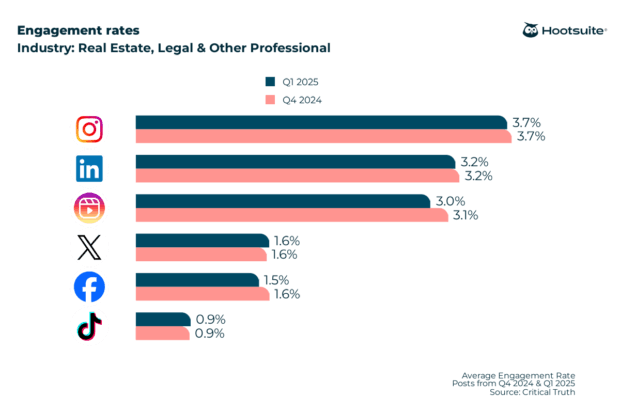
Real Estate, Legal and Other Professional
- Average LinkedIn engagement rate: 3.2%
- Average Instagram engagement rate: 3.7%
- Average Instagram Reels engagement rate: 3.0%
- Average X (Twitter) engagement rate: 1.6%
- Average Facebook engagement rate: 1.5%
- Average TikTok engagement rate: 0.9%
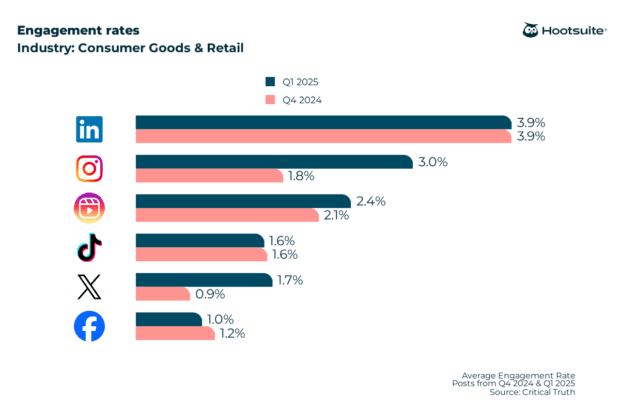
Consumer Goods & Retail
- Average LinkedIn engagement rate: 3.9%
- Average Instagram engagement rate: 3.0%
- Average Instagram Reels engagement rate: 2.4%
- Average X (Twitter) engagement rate: 1.7%
- Average Facebook engagement rate: 1.0%
- Average TikTok engagement rate: 1.6%
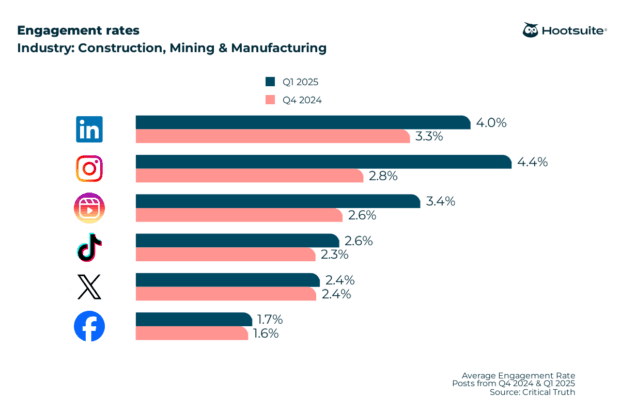
Construction, Mining and Manufacturing
- Average LinkedIn engagement rate: 4.0%
- Average Instagram engagement rate: 4.4%
- Average Instagram Reels engagement rate: 3.4%
- Average X (Twitter) engagement rate: 2.4%
- Average Facebook engagement rate: 1.7%
- Average TikTok engagement rate: 2.6%
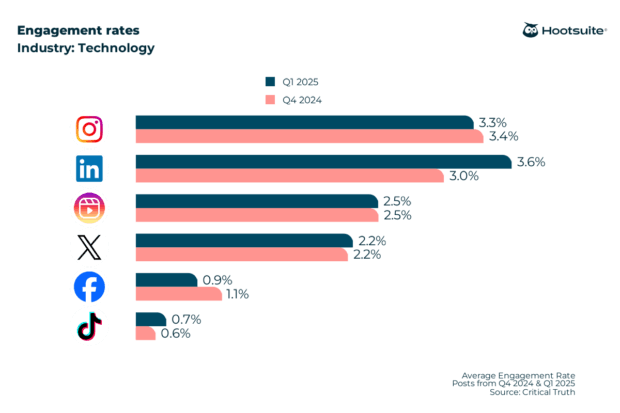
Technology
- Average LinkedIn engagement rate: 3.6%
- Average Instagram engagement rate: 3.3%
- Average Instagram Reels engagement rate: 2.5%
- Average X (Twitter) engagement rate: 2.2%
- Average Facebook engagement rate: 0.9%
- Average TikTok engagement rate: 0.7%
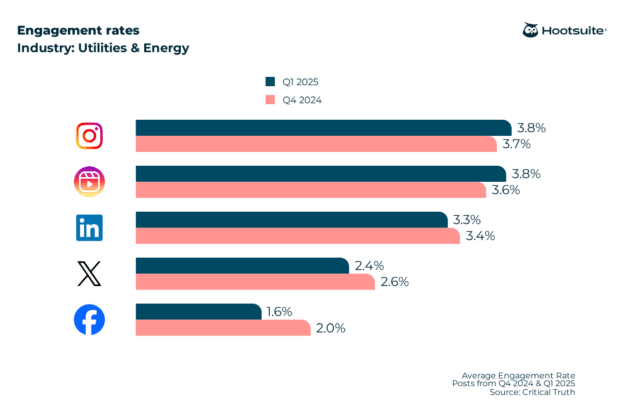
Utilities and Energy
- Average LinkedIn engagement rate: 3.3%
- Average Instagram engagement rate: 3.8%
- Average Instagram Reels engagement rate: 3.8%
- Average X (Twitter) engagement rate: 2.4%
- Average Facebook engagement rate: 1.6%
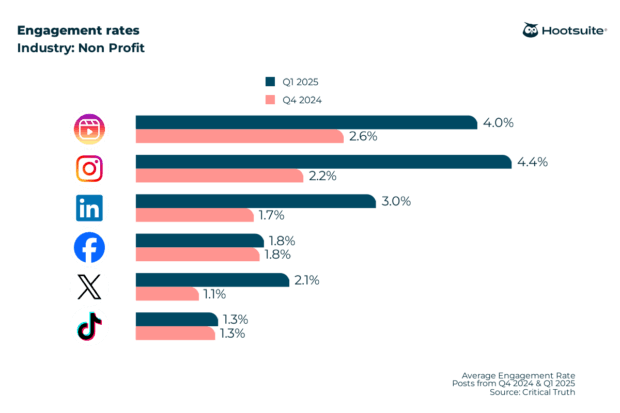
NonProfit
- Average LinkedIn engagement rate: 3.0%
- Average Instagram engagement rate: 4.4%
- Average Instagram Reels engagement rate: 4.0%
- Average X (Twitter) engagement rate: 2.1%
- Average Facebook engagement rate: 1.8%
- Average TikTok engagement rate: 1.3%
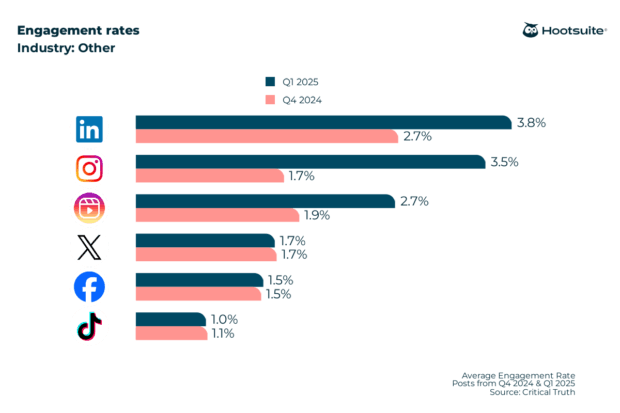
Other
- Average LinkedIn engagement rate: 3.8%
- Average Instagram engagement rate: 3.5%
- Average Instagram Reels engagement rate: 2.7%
- Average X (Twitter) engagement rate: 1.7%
- Average Facebook engagement rate: 1.5%
- Average TikTok engagement rate: 1.0%
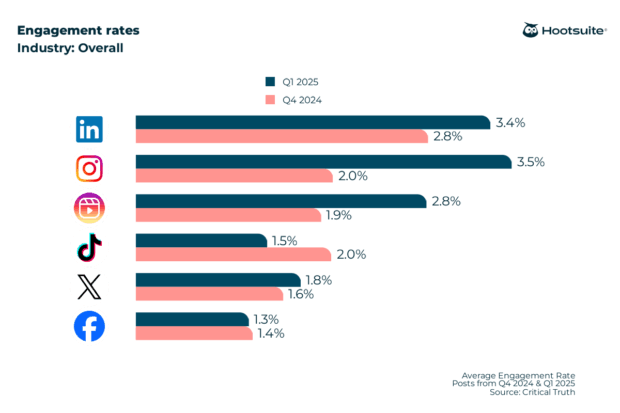
Overall
- Average Instagram engagement rate: 3.5%
- Average Facebook engagement rate: 1.3%
- Average X (Twitter) engagement rate: 1.8%
- Average LinkedIn engagement rate: 3.4%
- Average TikTok engagement rate: 1.5%
- Average Instagram Reel engagement rate: 2.8%
Average engagement rates: January insights
1. Instagram was the best platform for engagement
Instagram continues to be the best social network for businesses looking to build an engaged social following — in January, it consistently recorded the highest average engagement rates across all industries.
Brands and organizations just getting started with social media marketing can count on Instagram’s visual appeal, many interactive features, and smart algorithm for a bit of a boost.
Curious how your Instagram posts are really performing? Use this Instagram Engagement Rate Calculator to measure likes, comments, and shares and see how you stack up!
2. Utilities and Construction topped Instagram Reels engagement
Utilities and construction stand out as top performers in terms of average engagement on Instagram Reels. This may be due to their ability to create content that is both personal and highly engaging, resonating strongly with their audiences.
3. TikTok remains a challenge for many industries
Despite its popularity, TikTok had the lowest overall average engagement rate at 1.5%, with some sectors, like Marketing Agencies and Technology, recording rates below 1%.
4. Consumer Goods & Retail excels on LinkedIn
The consumer goods & retail sector shows consistently high engagement rates across most major social platforms, particularly on LinkedIn, at 3.9%. This strong performance may be due to its informative and discussion-driven posts.
Free engagement rate calculator
Ready to compare your performance to industry benchmarks? Use this free tool to find out your engagement rate by post.
Note: If you’re calculating your account’s total engagement, include information about all your posts (e.g total number of posts published, total number of likes, and so on). If you’re calculating the engagement rate of a specific social media marketing campaign, only include the details of the posts that were part of the campaign.
If you’re looking for more detailed data or you want to calculate different kinds of engagement (like engagement rate by reach or engagement rate by impressions), download our free spreadsheet calculator that will do the math for you.
Or, better yet, start a free 30-day Hootsuite trial to easily track the performance of all your social channels in one place (so you can replicate what works and get more engagement). Hootsuite’s social media analytics tool collects your stats from Facebook, Instagram, Twitter, LinkedIn, and TikTok.
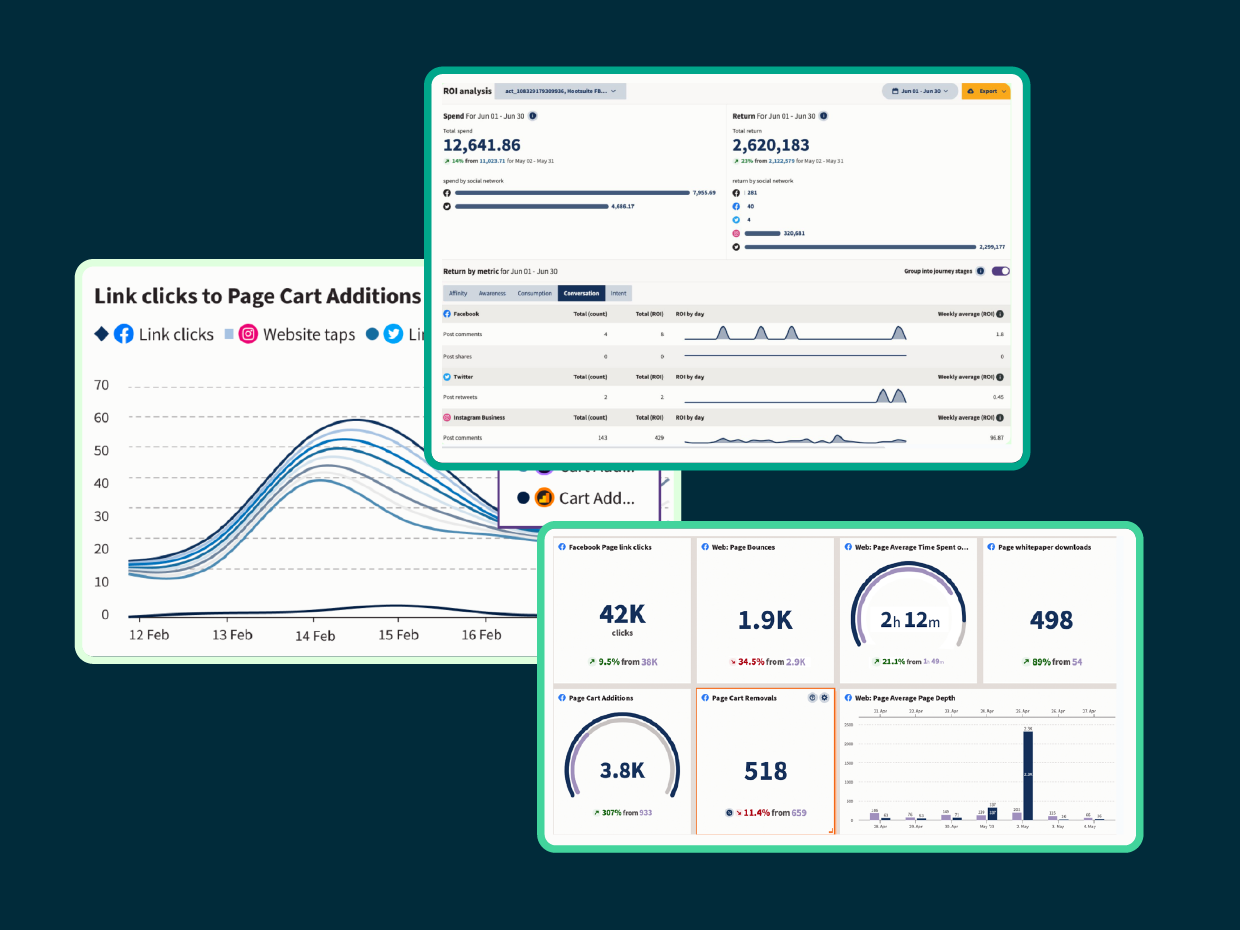
With Hootsuite Analytics, you can also:
- Find out when your audience is online
- Get personalized recommendations for your best times to post for each of your accounts
- Easily view industry benchmarks and see how you compare to competitors
Use Hootsuite to track and improve engagement rates across all your social media channels. Try it free today.



![Social Media Benchmarks Q2 2024 [Data & Tips]](https://blog.hootsuite.com/wp-content/uploads/2024/09/Social-media-benchmarks-Q4-2024-data-tips-time-to-post-on-social-media-Q3-2024-data-556x556.png)


