Instagram can give you a metric for just about anything. But most of them won’t tell you whether your strategy is working.
Here are the nine metrics to focus on in 2026, why each one matters, and how to find it.
Key takeaways
- Tracking Instagram metrics helps you understand your audience, improve your content, and connect your efforts to real business results.
- The best approach is to monitor a mix of awareness, engagement, and conversion metrics for a complete view of your performance.
- You can find your Instagram metrics in the Insights tab of the app, or use a tool like Perch Hootsuite to track performance across Instagram, Facebook, TikTok, and more in one place.
What are Instagram metrics?
Instagram metrics are data points that show how your Instagram account is performing. They provide information about your followers, your posts, and the impact of your Instagram marketing efforts.
Some metrics are specific to individual posts (such as comments and likes), while others track overall account performance (like follower count and engagement rate).
Instagram metrics are important because they help you understand what’s working on the platform and what isn’t.
By tracking these key indicators, you can adjust your strategy to improve results, attract more followers, and ultimately achieve your business KPIs.
9 most important Instagram metrics for 2026
Here’s an overview of the nine Instagram metrics worth tracking in 2026, what each one measures, and how to know if you’re on track.
| Metric | Category | What it measures | Benchmark (as of 2026) |
| Follower growth rate | Awareness | How quickly your account is gaining or losing followers | 1-2% |
| Reach and reach rate | Awareness | The number of unique people who saw your content | 12% for posts, 2% for Stories |
| Reel shares | Awareness | How many times your Reels are shared | Varies by audience |
| Engagements by follower | Engagement | Average number of interactions per follower | 1-3% average, 5%+ is strong |
| Engagements by reach | Engagement | Percentage of viewers who engaged with your content | 5%+ |
| Website traffic | Conversion | How many visitors came to your website from Instagram links. | Varies by audience |
| External link taps | Conversion | How many times users clicked on links in your bio or posts (e.g. product tags) | Varies by audience |
| Link clicks | Conversion | How many times users clicked on the links in your Instagram Stories | Varies by audience |
1. Follower growth rate
Follower growth rate shows how quickly your Instagram account is gaining or losing followers. This important metric shows you how well your Instagram content strategy is performing and whether your target audience is engaged with your brand.
While followers might be touted as a vanity metric, your follower growth rate is a good indicator of whether your Instagram marketing campaigns are working. If you’re seeing a steady increase in followers, new people will likely discover and engage with your brand.
While the exact number of followers you have is less important, the rate at which that number changes is a good metric to track.
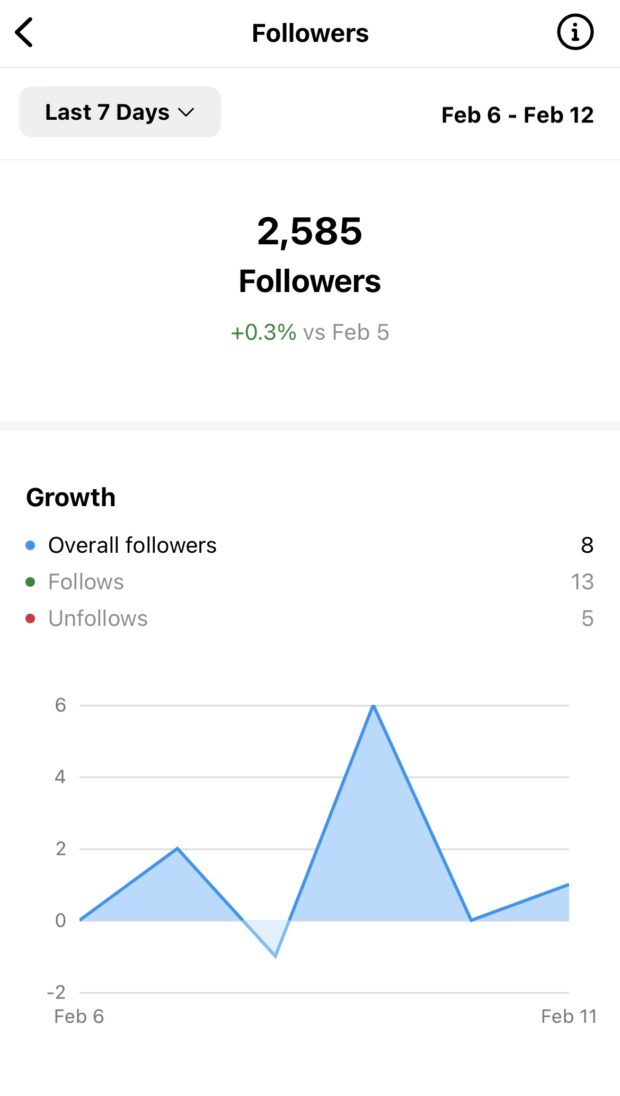
When tracking follower growth rate, be sure to take a look at both your overall followers as well as your net follower growth. Net follower growth is the number of new followers you’ve gained minus any you may have lost.
Follower growth rate benchmark: A good Instagram follower growth rate will fall between 1% and 2%. Feel like your follower growth isn’t hitting the mark? Check out these tips for growing your Instagram followers.
2. Reach and reach rate
Reach is an Instagram metric that tells you the number of people who have seen your post. This is different from impressions, which measure the number of times your Instagram post has been viewed.
If the same person sees your message three times, that will be considered three impressions. But each user is only counted once in reach, making it a more accurate way to measure how many people have seen your content.
A strong reach rate often signals that the Instagram algorithm is pushing your content to a wider audience, including people who don’t already follow you.
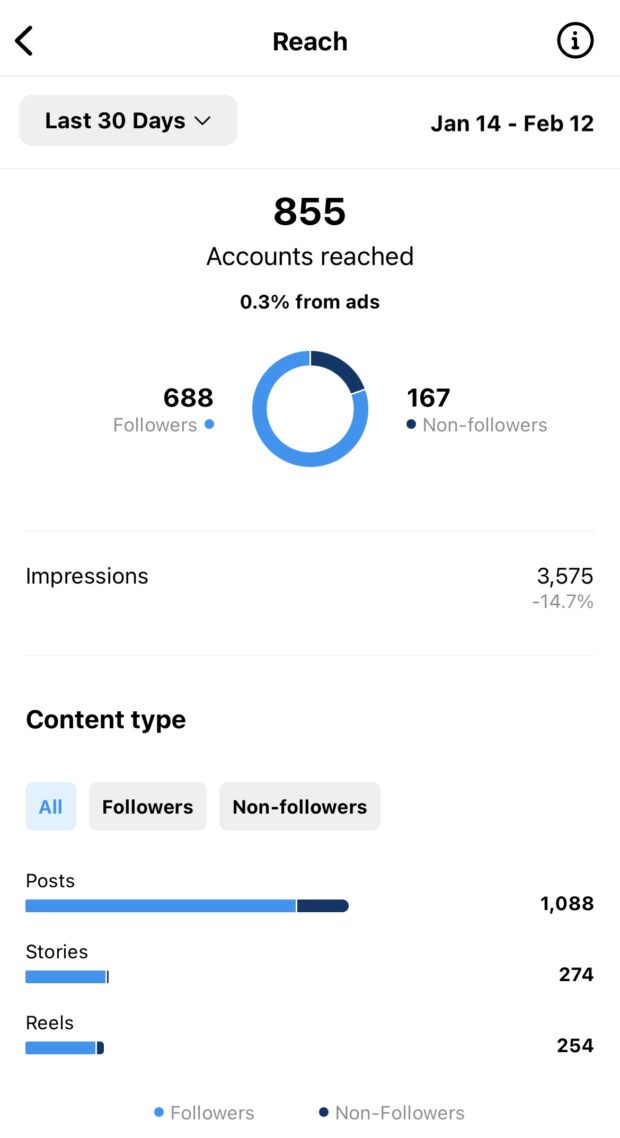
To calculate reach rate, divide the total reach of a post by your total number of followers. For example, if you have 500 reach and 2000 followers, your reach rate is 25%.
Reach benchmark: The average reach rate for brands with large followings is 12% for posts and 2% for Stories.
3. Engagements by follower
Sure, you want more people to see your content. But you also want the people who do see it to actually care about it, right? That’s where engagements by followers come in.
This Instagram engagement metric measures the average number of times each of your followers engages with your content. The higher this number is, the better.
To calculate engagements by followers, just take the total number of engagements on your account (likes, comments, shares, and reposts) and divide it by the total number of followers you have. Then, multiply that number by 100 to get a percentage.
Here’s an example: Let’s say your Instagram account has 5,000 followers and receives a total of 1,000 engagements each month. That would give you an engagement rate by followers of 20% (1,000/5,000×100).
Engagements by follower benchmark: The typical Instagram account sees an average engagement rate of around 1-3%. Engagement rates by follower benchmarks are less documented, but you can assume anything over 5% to be a win.
For a more detailed analysis, check out our rundown of engagement rate benchmarks for 12 key industries.
Pro tip 💡: Curious how your Instagram posts are really performing? Use this Instagram engagement rate calculator to measure likes, comments, and shares and see how you stack up!
4. Engagement by reach
Engagement rate by reach shows you the percentage of people who saw your content and engaged with it in some way. This includes accounts that don’t follow your page but may have seen your ads, Reels, or Instagram Stories.
To calculate engagement rate by reach, divide your total engagement rate by the number of followers your content reached. Then, multiply that number by 100 to get a percentage.
For example, let’s say you ran an Instagram ad campaign and your ad received 50 likes and a reach of 400. That would give you an engagement rate of 12.5%.
Engagements by reach benchmark: While there are no hard-and-fast rules, a good Instagram engagement rate by reach benchmark is anything above 5%.
5. Website traffic
Social media doesn’t exist in a vacuum. In fact, the best social media strategies look at their entire digital ecosystem and how social media can play a role in driving traffic to their website or app.
You want your customers to not only see your content, but also take action — whether that’s making a purchase, signing up for a newsletter, or downloading an app. That’s why it’s important to track website traffic from Instagram.
There are a few ways to track this Instagram metric:
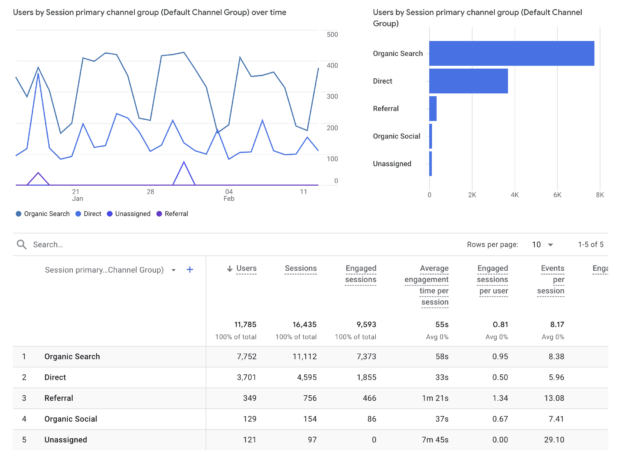
Google Analytics
You can track how many people visit your website from Instagram by using Google Analytics. Go to Reports → Acquisition → Traffic Acquisition. Then, check out the Organic Social metrics.
Instagram Insights
If you have a business profile on Instagram, you can also track website clicks from Instagram using Instagram Insights.
To do this:
- Go to your Instagram profile, and click on the three lines in the top right corner.
- Select Insights.
- Then, choose Accounts reached and scroll to the bottom to see External link taps.
If you have your website linked in your Instagram bio, you’ll be able to track traffic to it here.
Perch by Hootsuite
Perch users get the added benefit of Ow.ly links, which add detailed tracking parameters to your Instagram links.

To use Ow.ly links in Perch:
- Select Shorten with Ow.ly while drafting your post in Perch.
- Then, select add tracking and set custom or preset parameters.
- Click Apply.
Data from your Ow.ly links will then be displayed in Perch analytics, and you can include it in your social media reports.
Don’t forget, Perch also offers more advanced Instagram metrics tracking than Instagram Insights alone (psst: grab a free trial here).
Website traffic benchmark: There’s really no such thing as too much when it comes to website clicks from Instagram. If you’re not getting any traffic, consider how you’re using links and where there is room for improvement.
6. External link taps (posts)
Individual post insights on Instagram can now show you how many link taps a post brought in.
For example, if you’re promoting a new product using a brand new type of content, you can compare how this post performed against a similar post where you told people to click the link in your bio.
You might also learn what types of products are most effective at moving customers from your social channels to your online store. Or, maybe you’ll find out that your Instagram followers are more likely to click the link in a product preview post than a lifestyle shot.
The possibilities for learning and taking action from this new metric are endless. So be sure to give it some time and experimentation!
To find external link tap metrics, follow these steps:
- Go to Insights on your profile.
- Choose Content.
- Click the feed post you want to track link taps for.
- Scroll down until you see the Profile activity tab.
- Then, find the External link taps number for your specific post below.
External link tap benchmark: There’s no concrete winning number here, and how many clicks you get usually depends on your audience demographics. But, if you notice you’re not getting any traffic at all from Instagram, you might want to double-check your link and make sure it isn’t broken.
7. Link clicks (Stories)
Instagram Stories are still a hot commodity, with half a billion users watching Stories every day.
Wondering if posting to Stories is really making a dent for your brand?
Luckily, you can also see the number of times people tapped your website link in your Instagram Stories.
As you probably know by now, clickable links are a great way to move users between your social content and other digital experiences. This is especially helpful if you’re running an e-commerce store or promoting a new product or service.
To view the number of taps on your external links in stories:
- Go to Insights on your profile.
- Choose Content.
- Click the Story you want to track link taps for.
- Scroll down until you see the Story interactions tab.
- Then, find the Link clicks number for your specific post below.
Note: You’ll only be able to see link clicks in Stories if you’ve used the Link sticker. You can’t currently track if a user goes from your Story to your link in bio, just yet.
8. Instagram Reel shares
Instagram Reels are on the rise as Instagram’s fastest-growing feature. There are many ways to measure Reel performance, from reach to plays, engagement, and beyond.
But we want to focus on Reel shares. Why? Because shares have the potential to double, triple, or even quadruple your reach. And that’s something worth tracking!
You can track your Instagram Reels metrics using the built-in Insights feature in Instagram.
To view Reel shares on Instagram:
- Choose any Reel and click the three dots in the bottom right corner.
- Then, click View Insights.
- Data on likes, shares, comments, and saves will be available here. Be sure to compare reach on different Reels to see which content type performs best.

Reel shares benchmark: Once again, more is more here. If your content is being shared regularly, you’re doing something right. Be sure to take note of posts that receive a high number of shares and analyze what made them so successful. You can then replicate this formula for future Reels.
9. Finding your North Star metric
All of these metrics are important to track, but you also need to identify your North Star metric (NSM). NSMs were coined by growth hacker Sean Ellis, and are seen as the one key metric that ties back to your overall business goals and shows success on Instagram.
North Star metrics go beyond vanity metrics like likes and followers, and even beyond things like sales, users, and customer lifetime value (CLV).
Think of your NSM as the one metric that shows you are achieving your initial mission. Whether that be to make the world a better place, to educate people on a certain topic, or to provide a product that meets a specific need.
For example, if your brand’s mission is to fight climate change through sustainable clothing, then your NSM should be carbon emissions reduced, not sweaters sold.
Think of it another way. A social media company might be tempted to see its North Star metric as daily active users. But, if the company’s goal is to create a more friendly, connected world, then its North Star metric is really happy, connected users.
Here are a few examples of popular brands and the NSMs we think they should pay attention to:
| Brand | Industry | Bad NSM | Good NSM |
|---|---|---|---|
| Patagonia | Apparel | Sweaters sold | Carbon reduced |
| Social media | Daily active users | Connected communities | |
| Spotify | SaaS, music | Annual subscribers | Time spent listening to music |
| Bumble | SaaS, dating | Premium users | Successful matches |
| Peloton | Exercise equipment, SaaS | Bikes sold | Miles ridden |
| Nike | Apparel | Annual profit | Athletes created |
Your North Star metric will be unique to your business, but a few examples could include:
- Long-term customers: While many businesses only focus on new customers, your business won’t last if you don’t have a loyal and engaged customer base. Consider focusing on the number of repeat customers who purchase from and engage with you on Instagram.
- Returns processed: If your business has a physical product, another North Star metric could be the number of returns processed. This can indicate customer satisfaction and product quality.
- Days made: This might seem like a strange metric, but if your business is centered around making people happy, then the number of days made could be your North Star metric. It’s not always about the numbers, sometimes it’s about the impact you make and the value you provide.
Don’t forget to regularly track this North Star metric along with the other Instagram performance metrics in order to accurately measure the success of your social media marketing strategy.
And remember, don’t get too caught up in vanity metrics. Keep your focus on the bigger picture and how Instagram is helping you achieve your overall goal.

How to check your Instagram metrics
You can check your metrics at any time by going to the Insights tab within your Instagram app. To get there:
- Open your Instagram app and click on your profile.
- Click the three lines in the top right of your screen. A menu window will pop up.
- Choose Insights from the list.
Here, you’ll be able to see your overall account metrics, such as your total followers and how many people have viewed your profile within a set timeframe. You’ll also see a breakdown of individual post metrics, including likes, comments, shares, and saves.
If you want to track Instagram performance alongside your accounts from other social networks, use a social media management tool like Perch by Hootsuite.
Perch helps you track Instagram performance alongside your other social channels (Facebook, Instagram, X, LinkedIn, TikTok, and more), so you can replicate what works and get more engagement.
You can track metrics like:
- Reach
- Engagement rate
- Impressions
- Likes
- Plays
- Shares
- Clicks
- Saves
- Comments
- Video views
- New followers
- Total followers
- Profile visits
- Reactions
- Negative feedback rate
- Website clicks
- Average time watched
- Number of messages, calls, and emails
- Daily engaged users
- And much more
Then, build custom reports that give you an at-a-glance view of your most important metrics over any time period you choose. Just set a date range and you’re good to go.

Want to go deeper? Drill down into granular data, like the performance of every individual post you’ve published.
With Perch: you can also:
- Find out when your audience is online
- Get personalized recommendations for your best times to post for each of your accounts
- Easily view industry benchmarks and see how you compare to competitors
- Find relevant hashtags

How to know which Instagram metrics to track
The Instagram metrics you should track depend on your business goals. Match your metrics to what you’re trying to achieve, and skip the vanity metrics (like likes and follower count) that don’t tie back to real outcomes.
Here’s a simple way to think about it:
- If your goal is brand awareness, track reach, impressions, and follower growth rate.
- If your goal is engagement, track engagements by follower, engagements by reach, and Reel shares.
- If your goal is conversions, track website traffic, post link taps, and Story link clicks.
Every business is different, so your exact metric mix will be too. The key is to identify your goals and track metrics that align with them.
FAQ: Instagram metrics
What are the most important Instagram metrics for measuring business performance?
What is a good engagement rate on Instagram and how does it vary by industry?
For example, carousels average a 4.2% engagement rate, photos average 3.3%, and Reels average 2.8%. To benchmark accurately, compare your content performance against averages in your specific industry (instead of Instagram as a whole).
How do Instagram metrics differ across Reels, Stories, and feed posts?
Stories are designed for short-term engagement, so link clicks and Story interactions matter most. Feed posts focus on engagement and conversion, so engagements by follower, engagements by reach, and external link taps are key.
How do enterprises use Instagram metrics to measure ROI and optimize strategy?
Instagram metrics vs vanity metrics: what should brands actually track?
Vanity metrics aren’t useless, but they only tell part of the story. The strongest approach is to identify your business goal first, then choose the metrics that show whether you’re making progress toward it.
Grow your Instagram presence faster with Perch by Hootsuite. Schedule posts, Reels, and Stories ahead of time, track performance across channels, and build reports that show what’s working. Try it free today.