With top-of-the-feed placement, links, and interactive stickers, Instagram Stories is a prime channel brands can use to drive awareness, traffic, sales, and engagement. And Instagram Stories analytics can prove it.
Instagram Stories last a mere 24 hours — here today, gone tomorrow. But just because these pieces of content disappear doesn’t mean they can’t have a lasting impact on your audience. Track the right metrics, and you’ll learn exactly how to optimize your Instagram Stories to achieve your social media goals.
And we’re here to show you how. Read on for everything you need to know about Instagram Story analytics.
What are Instagram Story analytics?
Instagram story analytics show you how your stories are performing. There are three different types of metrics: engagement, reach, and navigation. By understanding these metrics, you can better understand what works for your audience and the opportunities to improve engagement.
How to view Instagram Story analytics
You’re just a few taps away from viewing all the sweet, sweet stats from your latest Instagram Story — just grab your phone and follow along. (Psst: You’ll need a Professional or Creator account to access analytics on your Instagram content.)
1. Open the Instagram app and tap on your profile.
2. Tap the menu icon in the top right corner (three vertical lines).
3. Tap Insights.
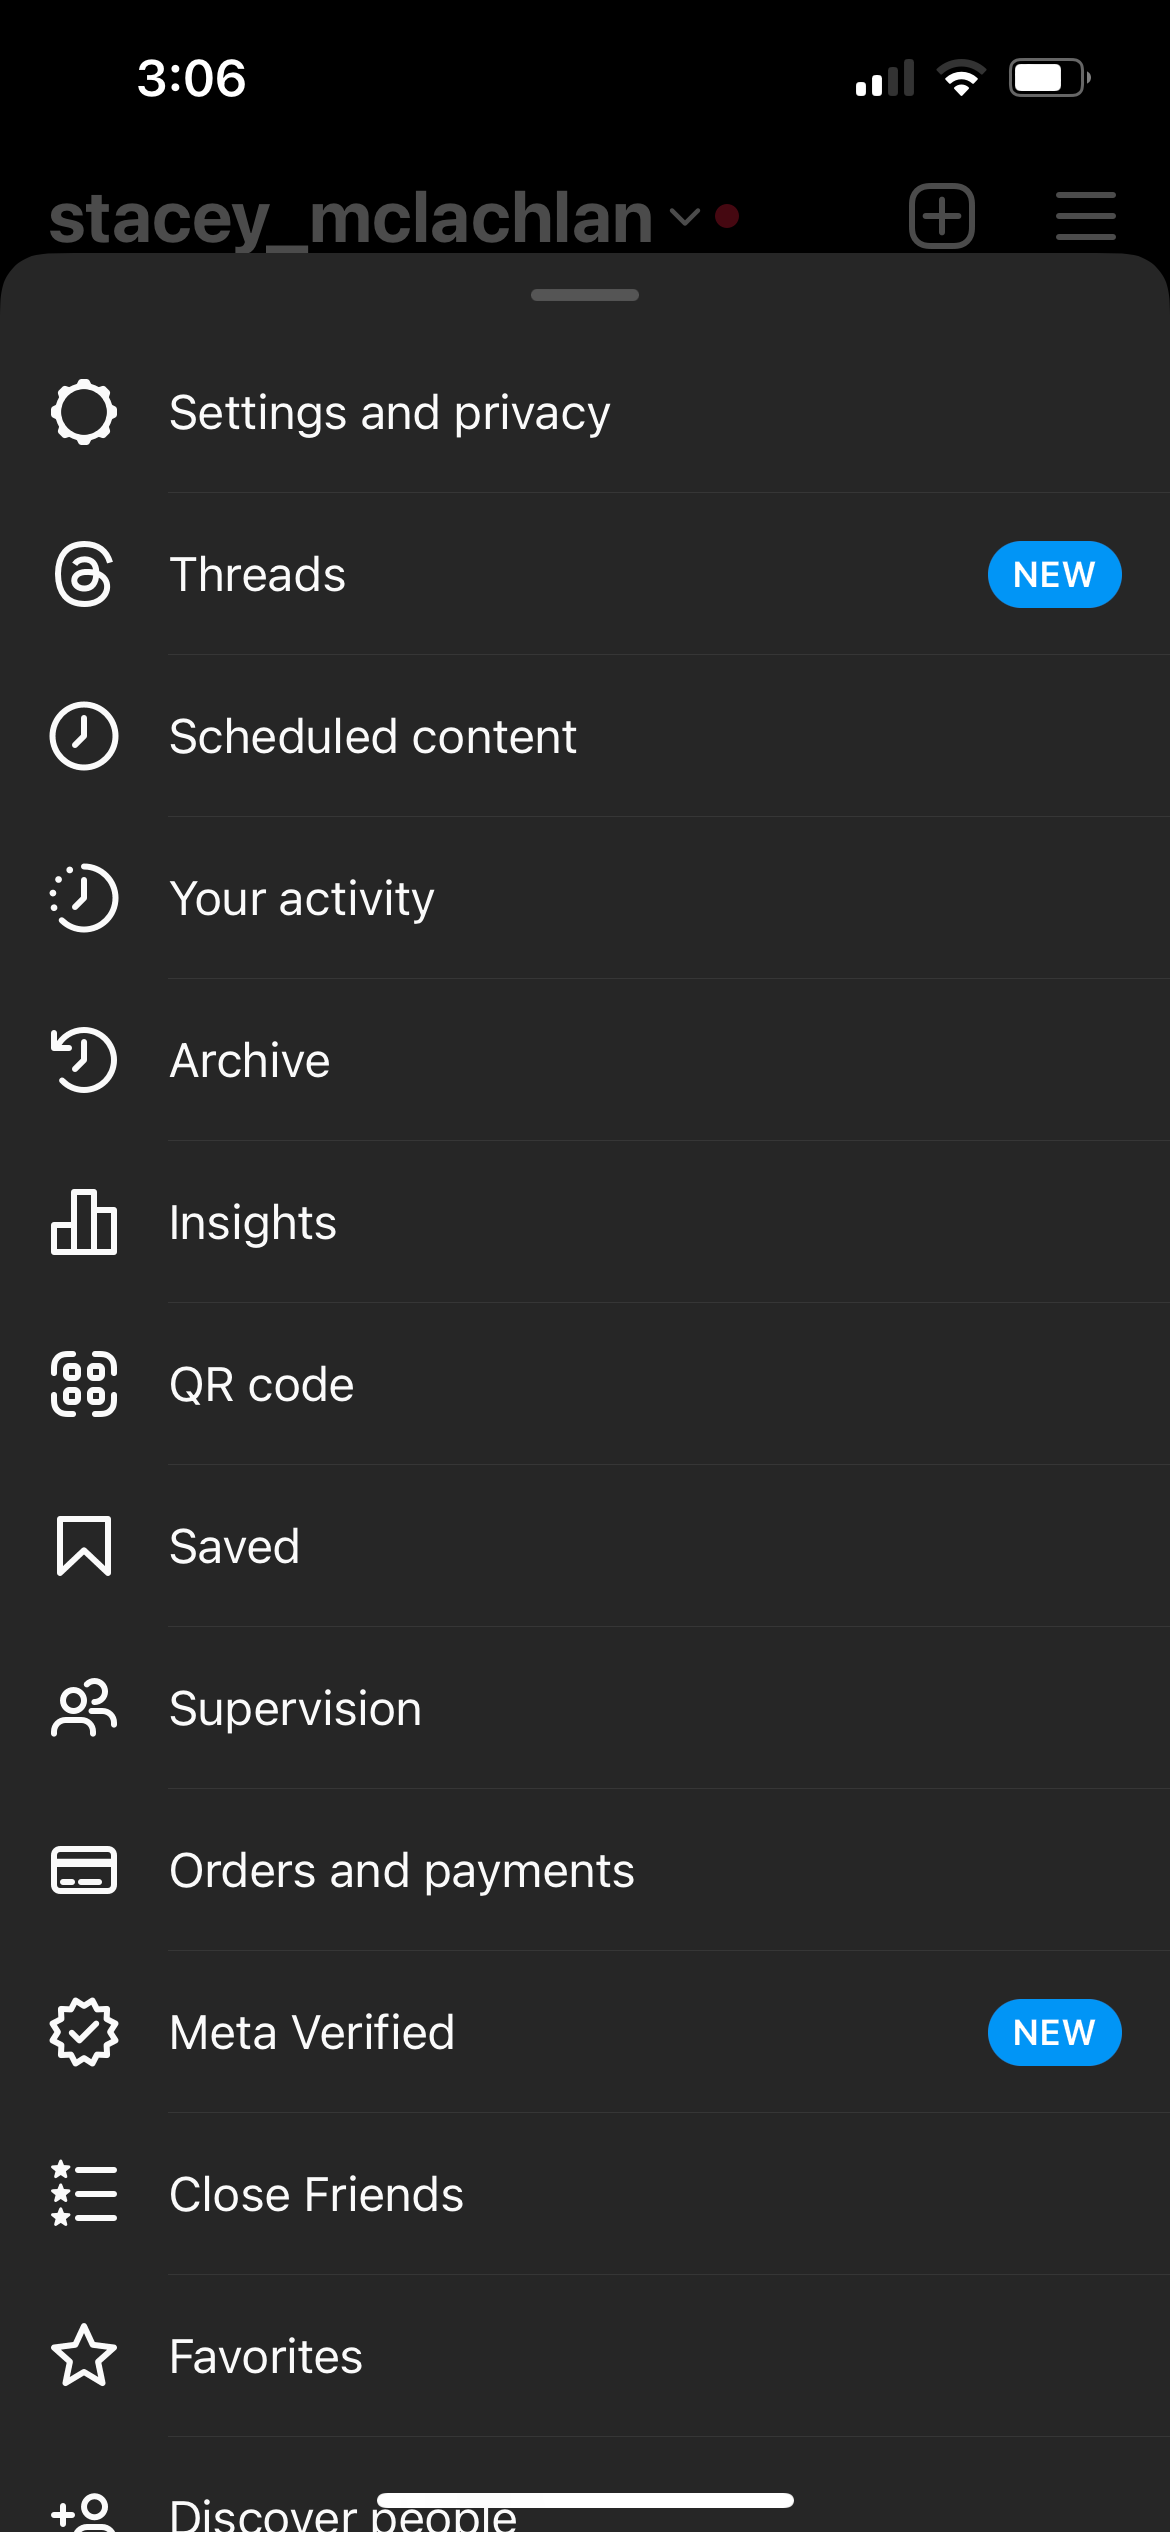
4. Scroll down to the section labeled Content You Shared and tap Stories.
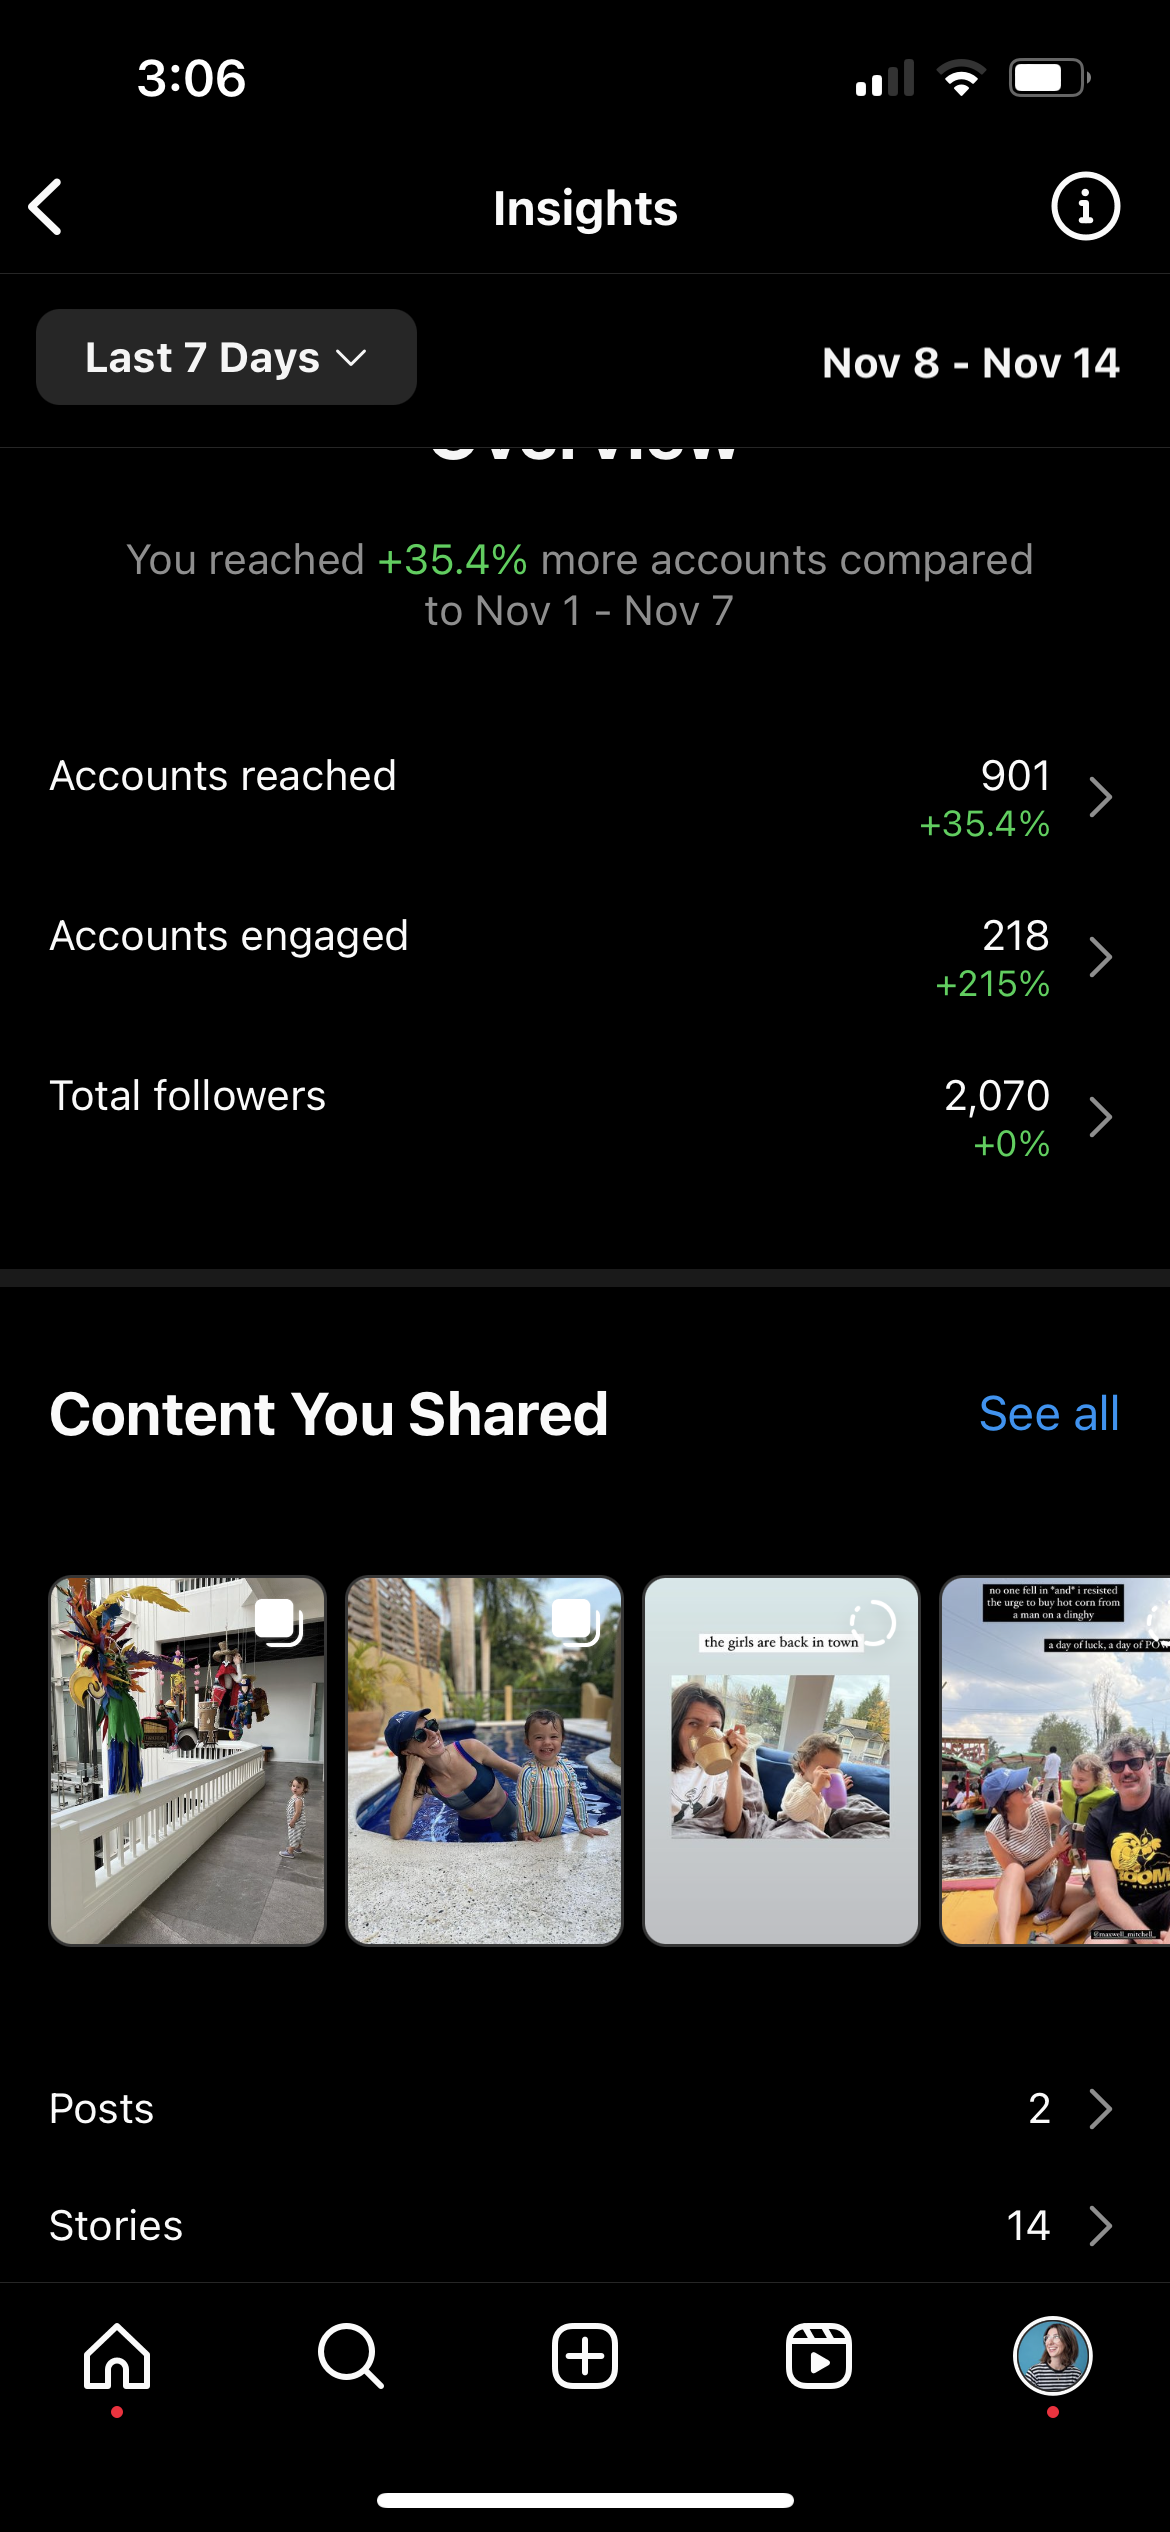
5. You’ll see a grid of your most recent stories, each labeled with their reach.
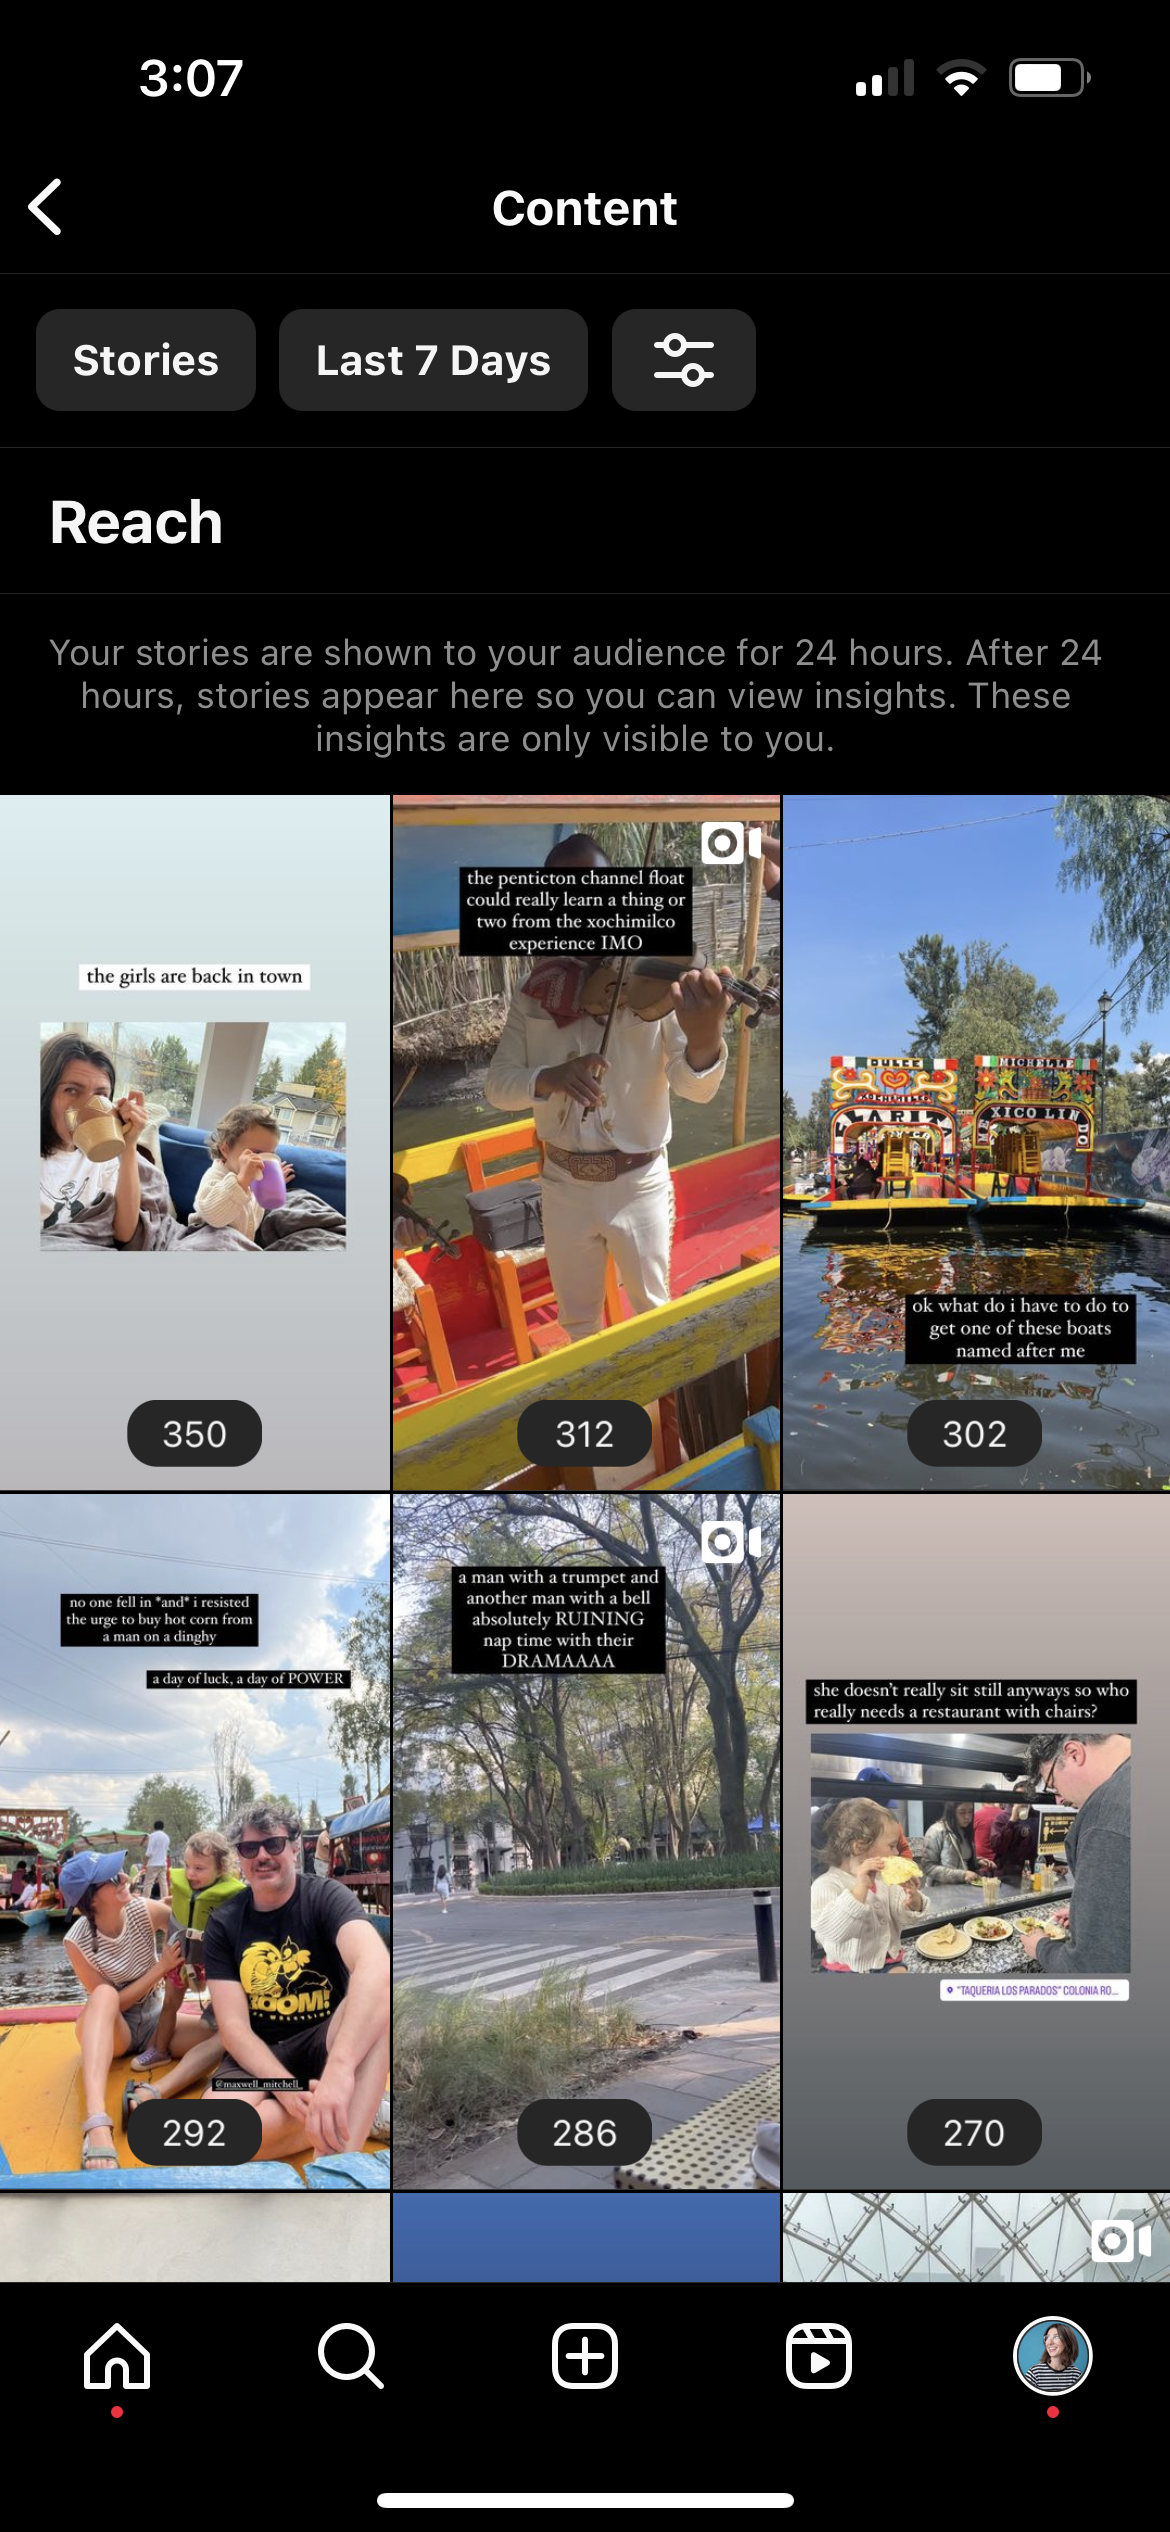
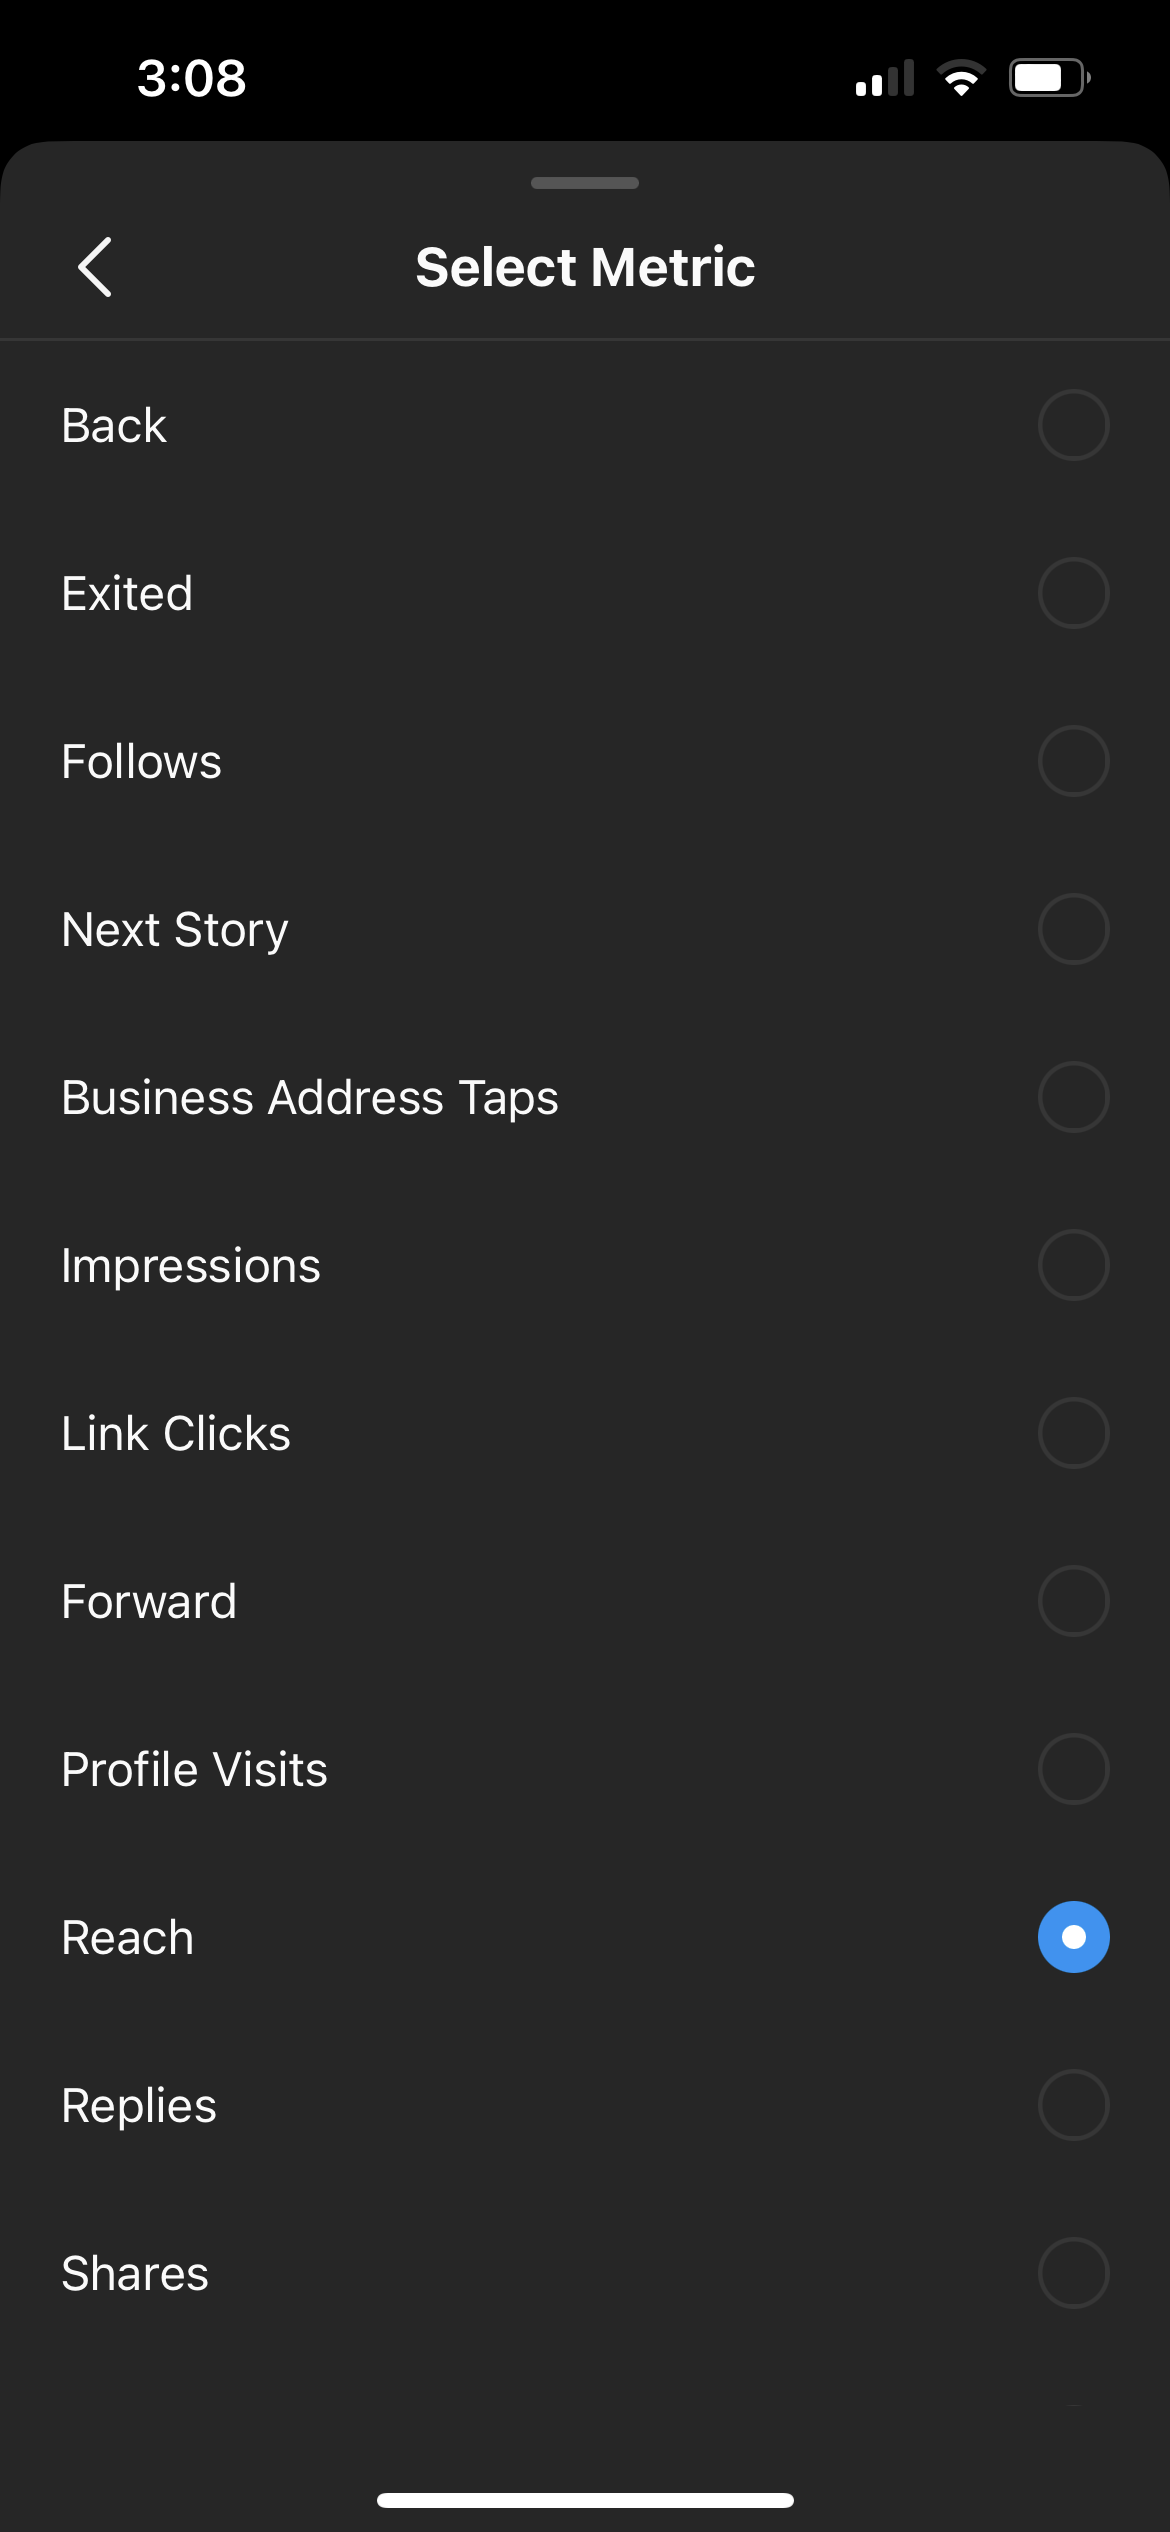
6. Tap the filter icon at the top of the screen to switch metrics. Current metrics include:
- Back
- Exited
- Follows
- Next Story
- Business Address Taps
- Impressions
- Link Clicks
- Forward
- Profile Visits
- Reach
- Replies
- Shares
- Website Taps
- Likes
- Story Interactions
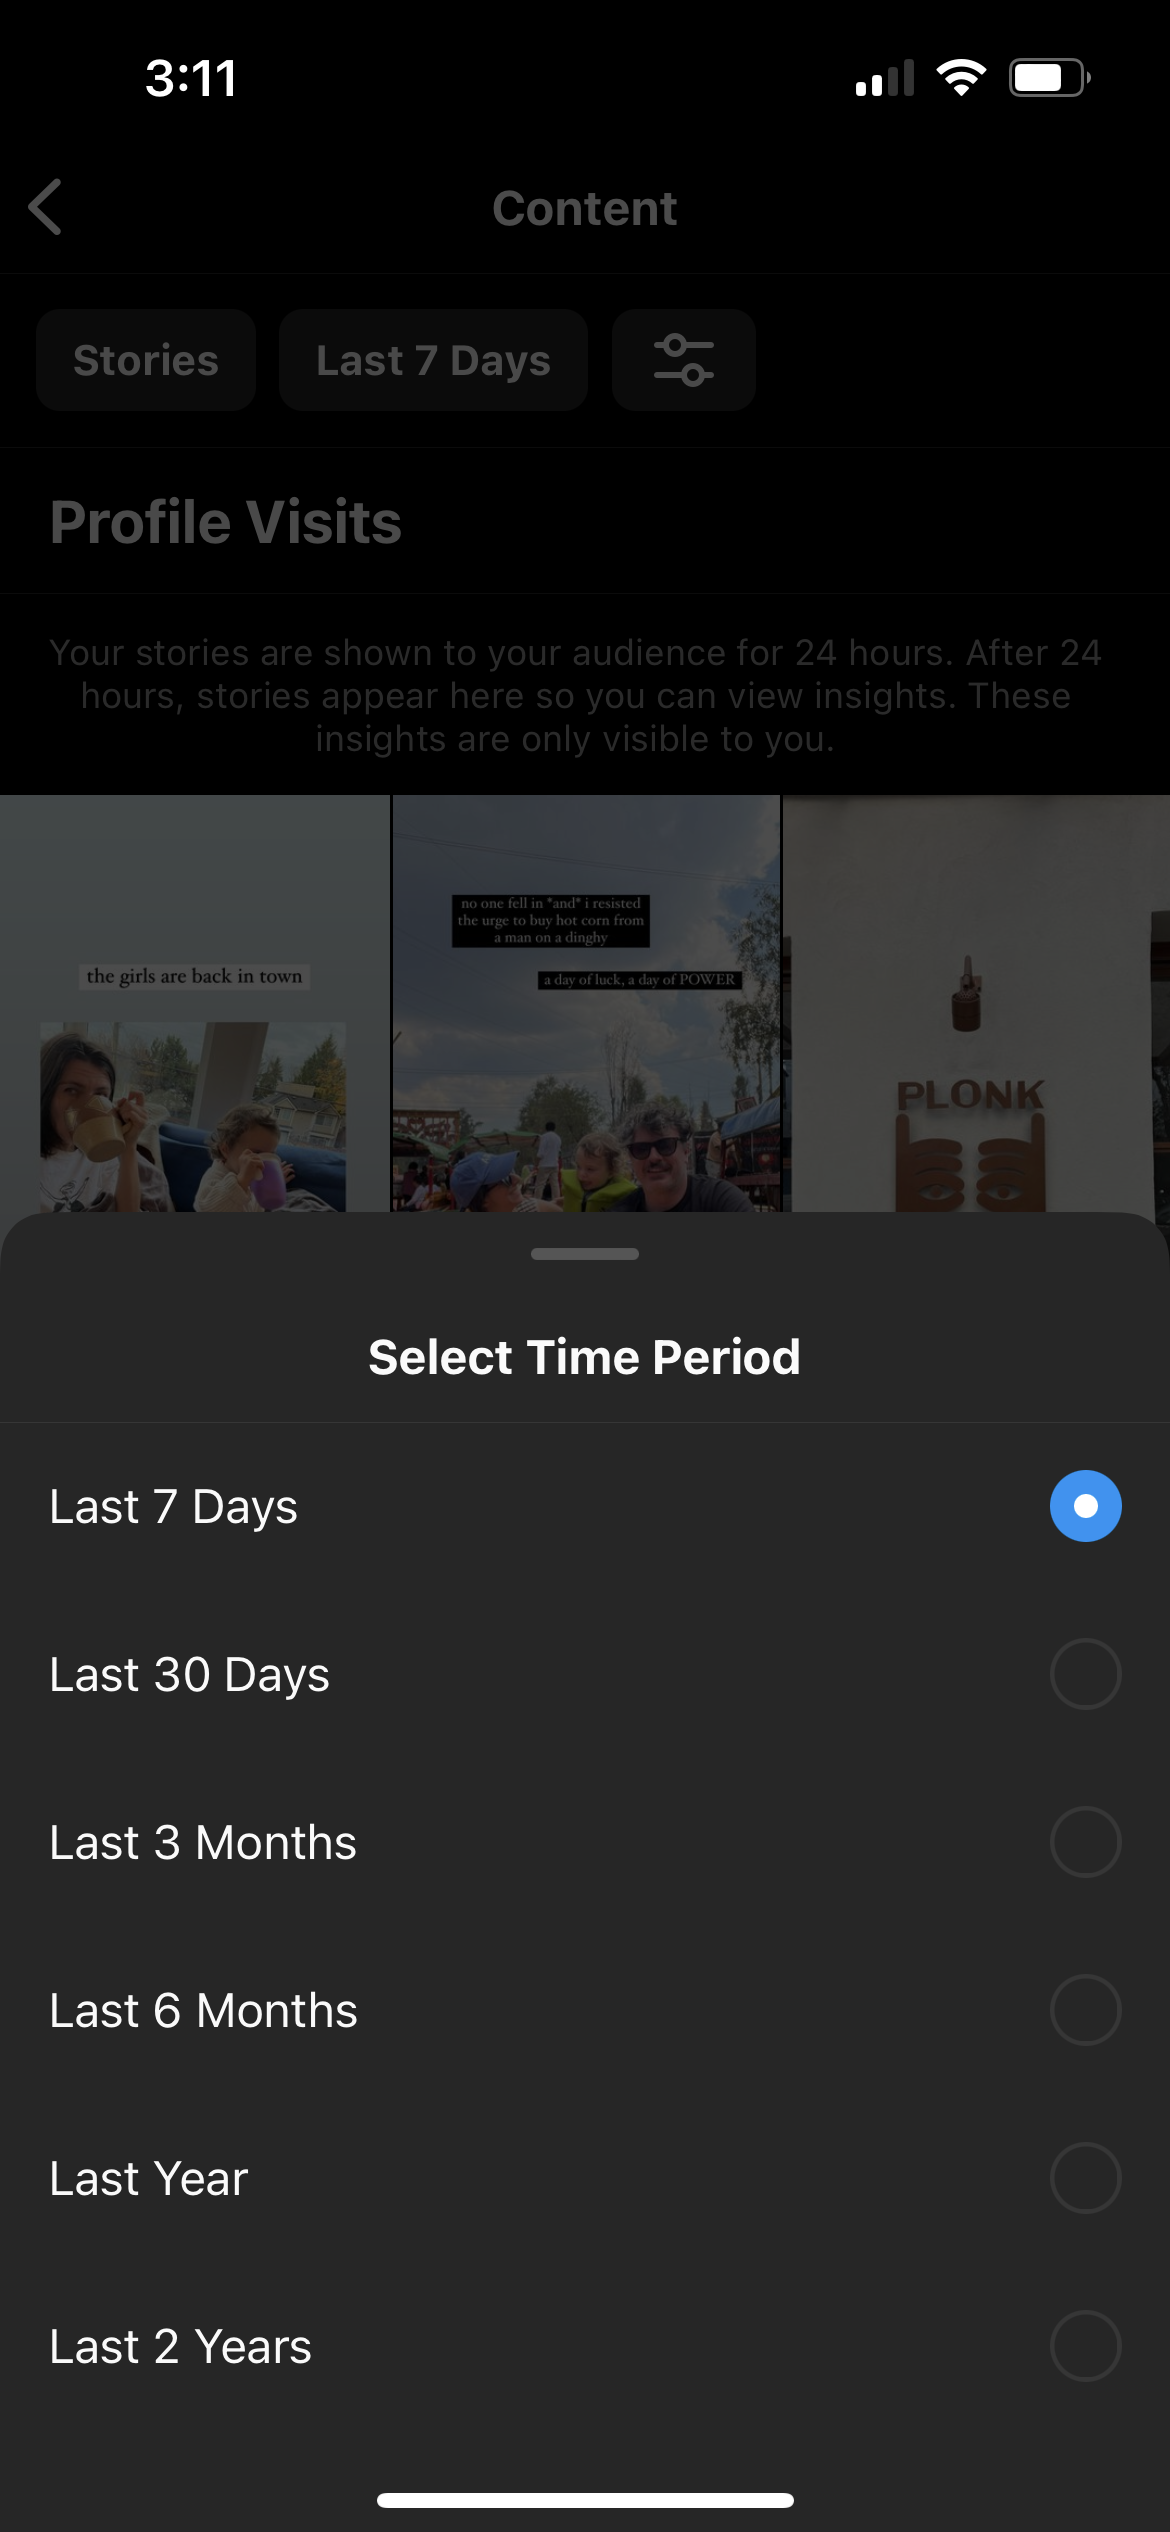
7. To change the time frame of the metrics, tap the button at the top of the screen that says Last 7 Days to view more options (like “Last 30 Days” or “Last 2 Years”).
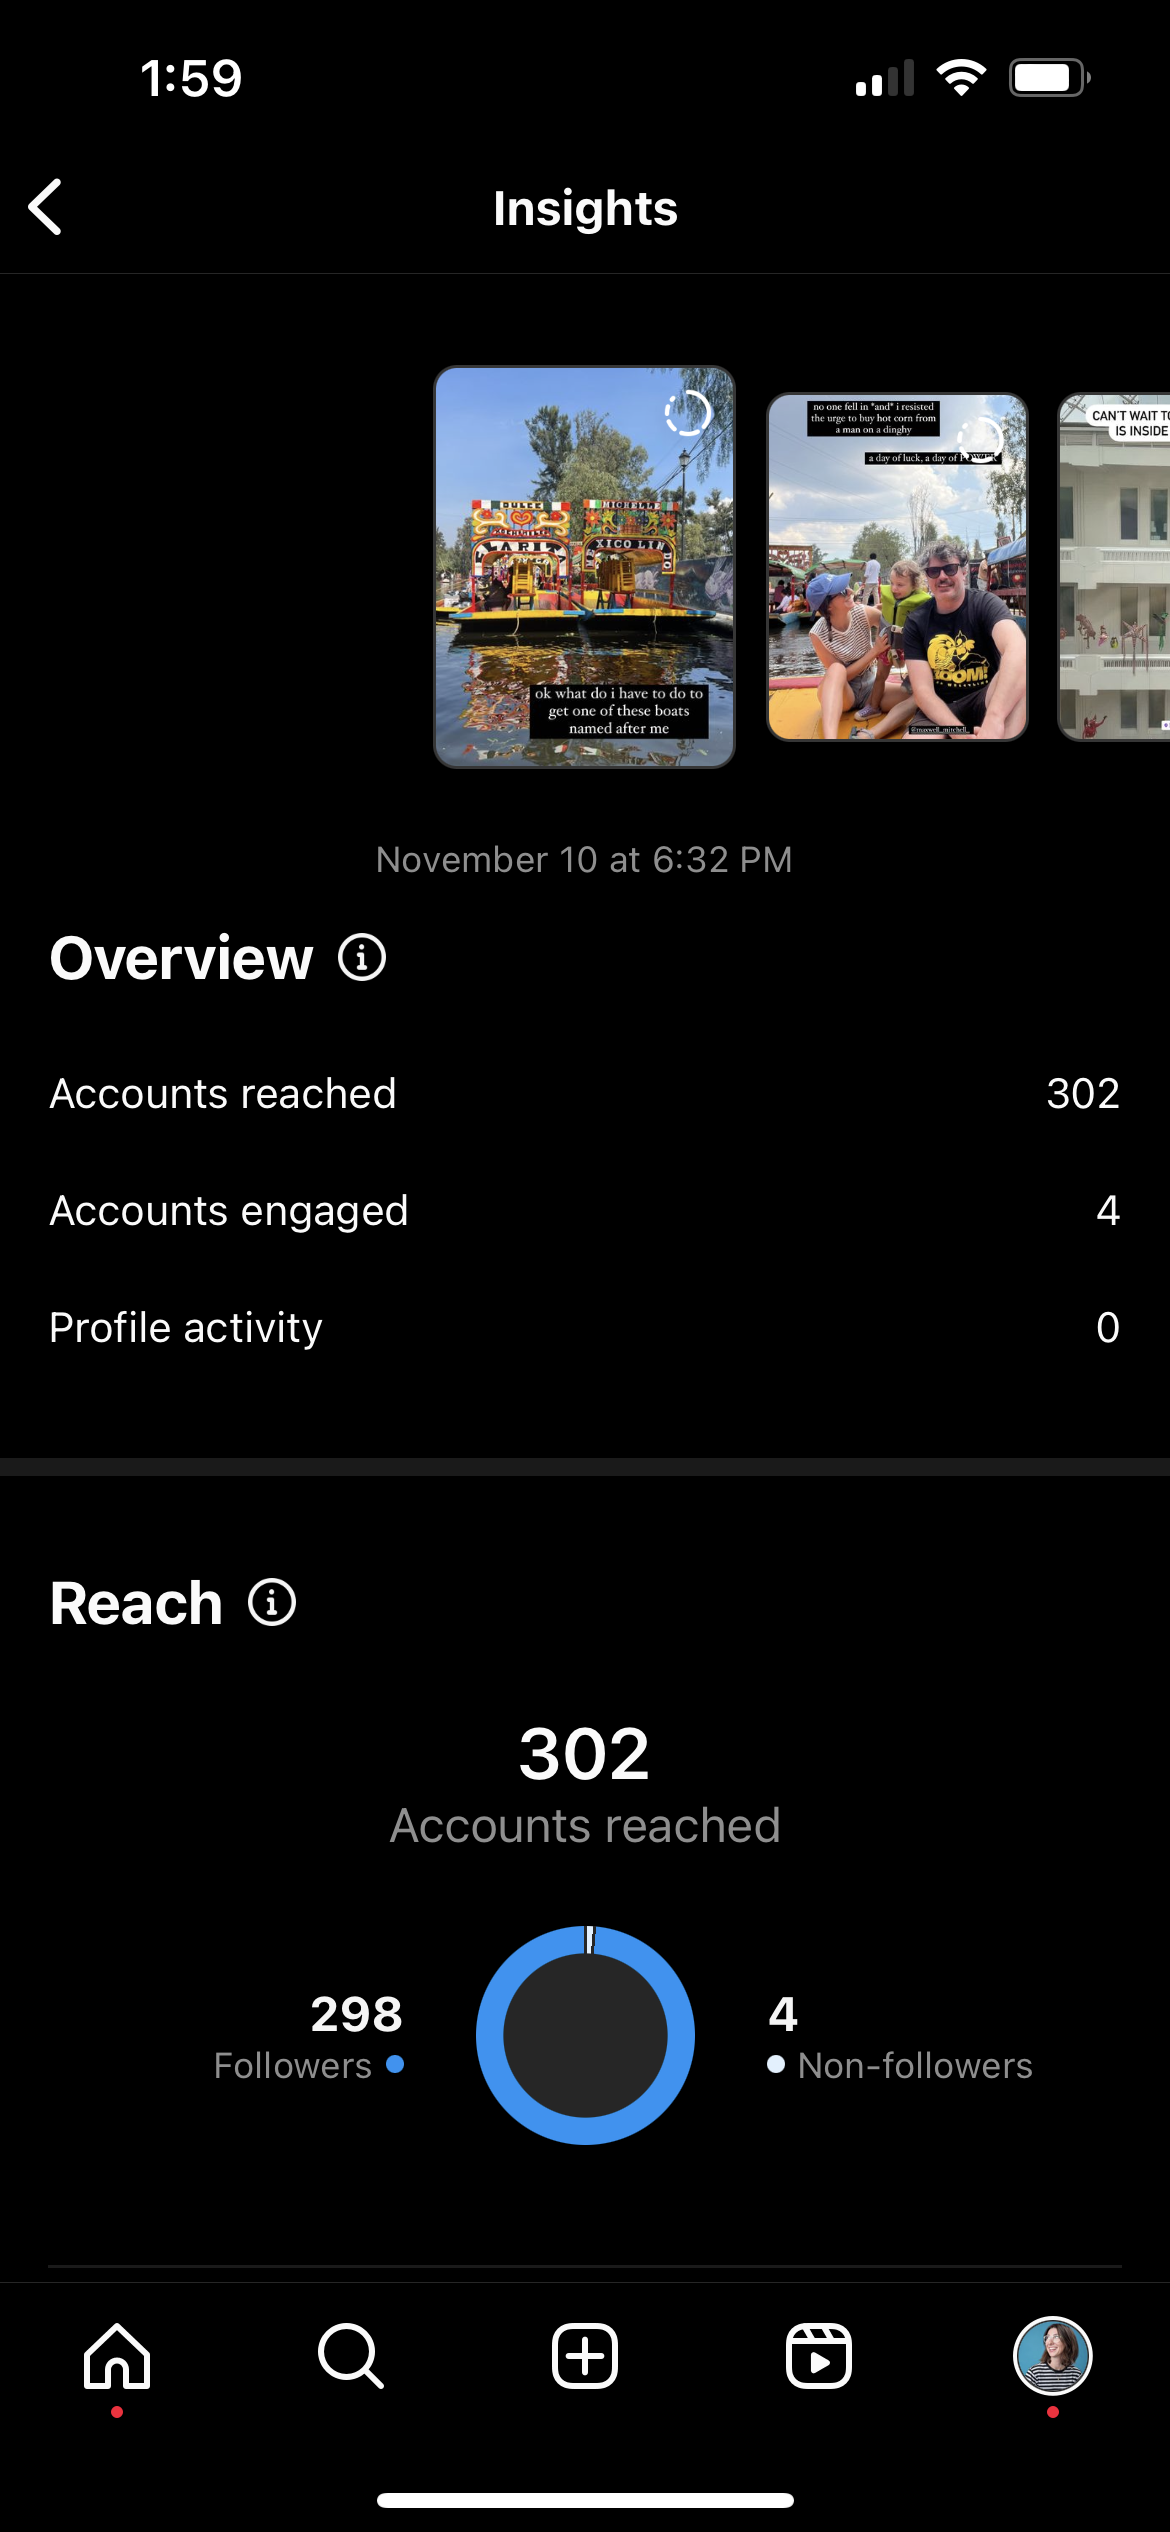
8. Tap on any Story to view detailed metrics of that particular piece of content. You can view how many accounts it reached, how many it engaged, how many interactions it got, and so on.
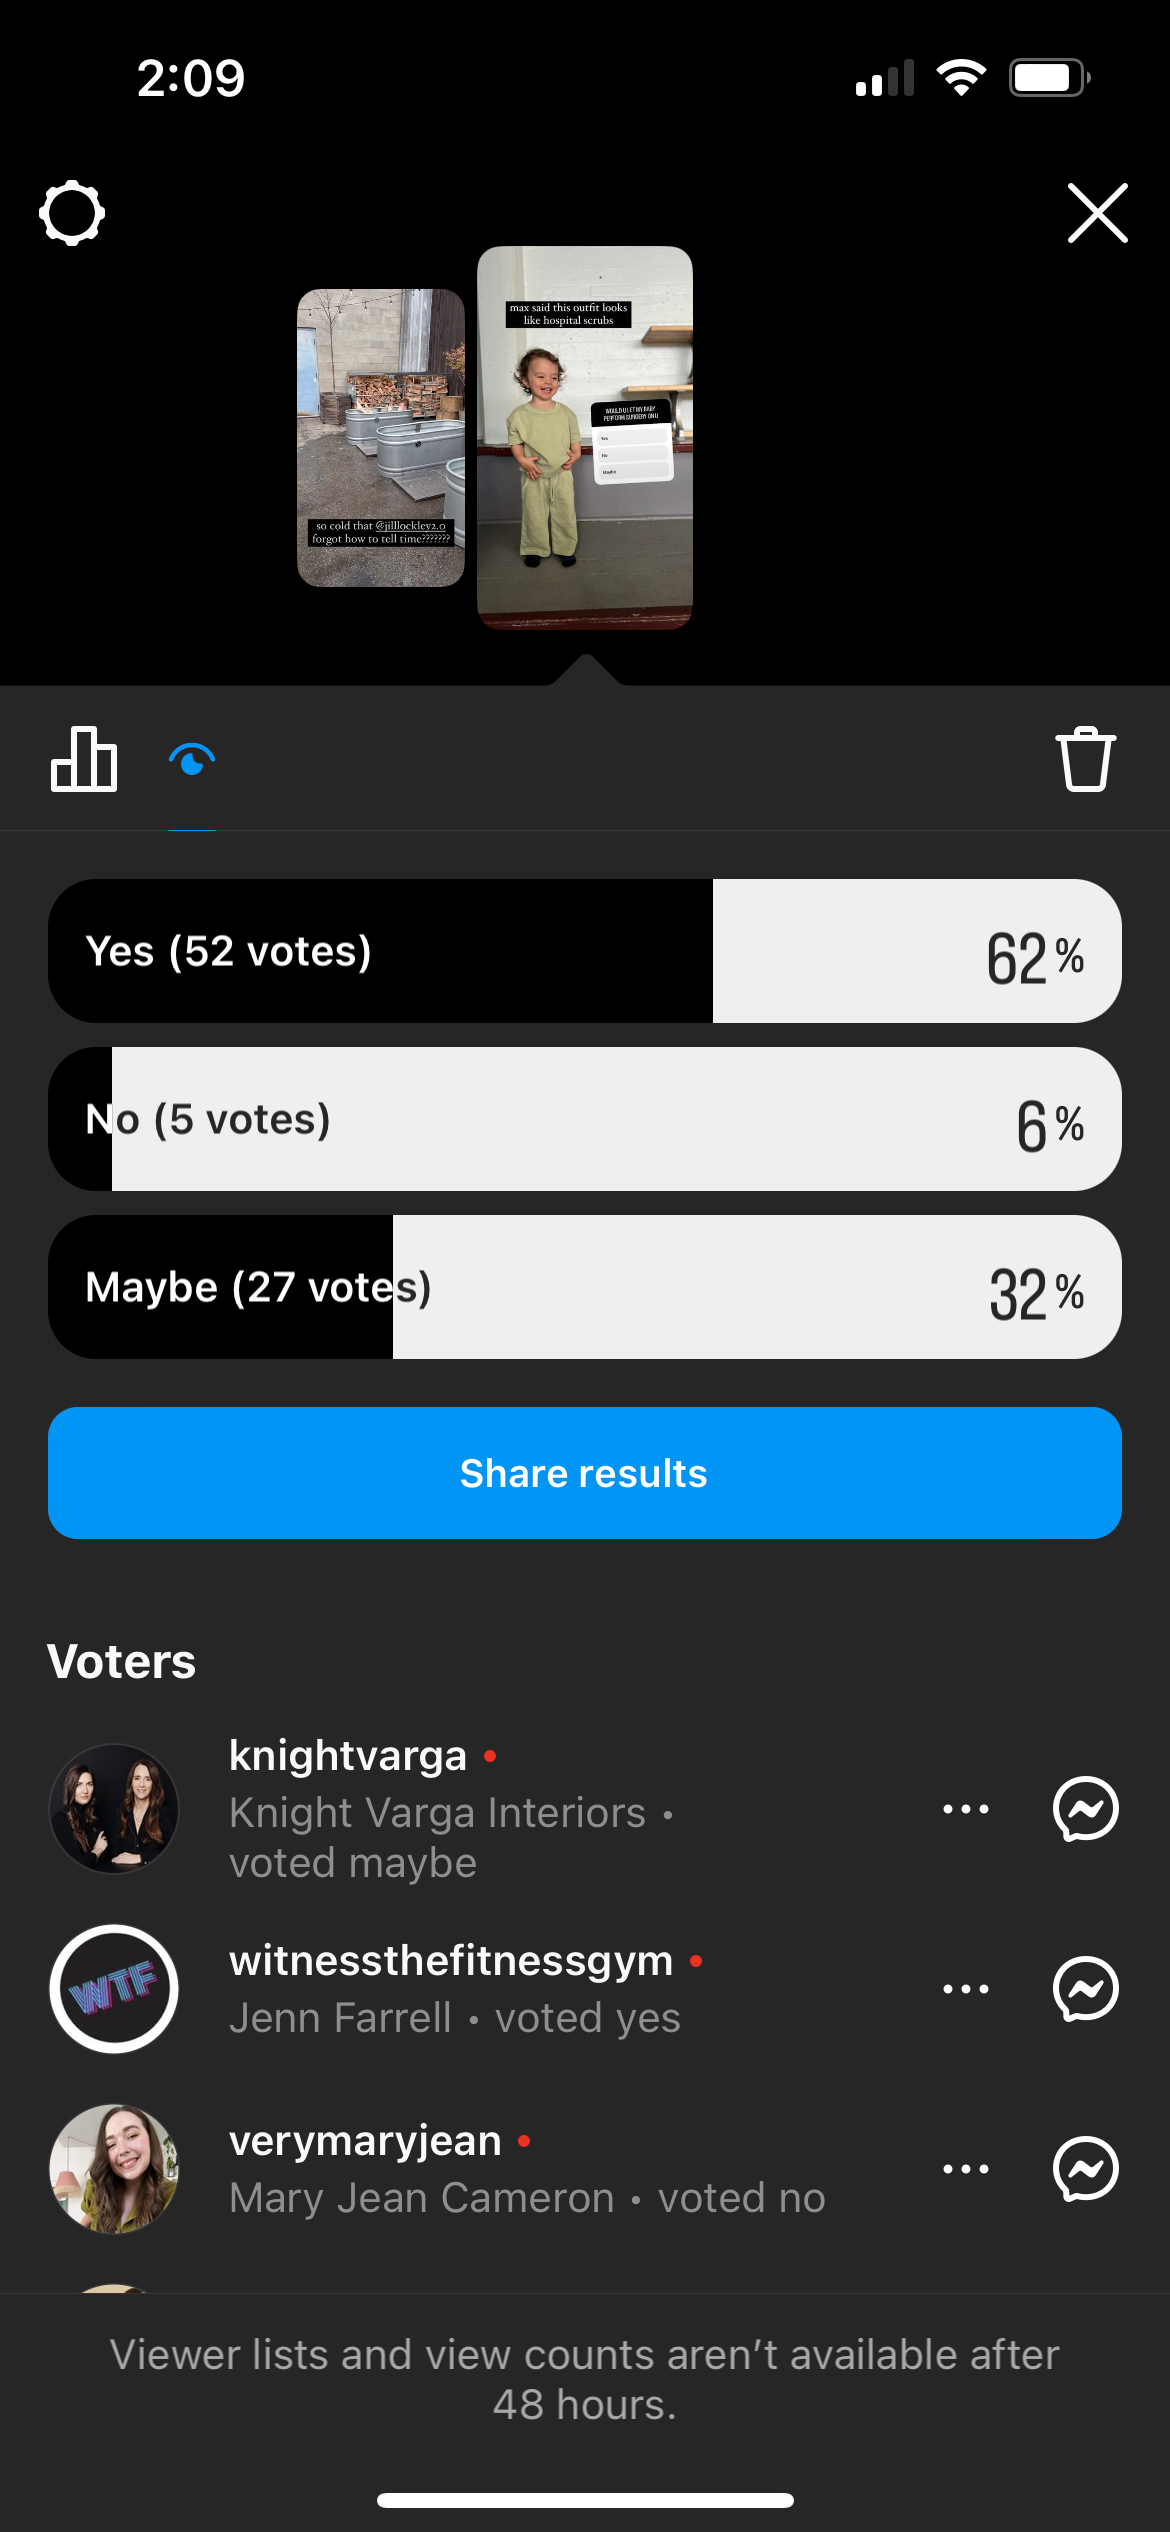
9. To view the results of a poll or interactive sticker, go into your Archives (via the three-vertical-line menu). Then, find the relevant Instagram Story and tap Activity in the bottom left corner.
15 Instagram Story metrics to track
There are 15 different metrics you can track for your Instagram Stories. But, not all metrics will be important to your brand or relevant to your social media goals.
Instagram Stories metrics are divided into Discovery, Navigation, and Interactions.
Instagram Story analytics: Discovery metrics
- Reach. The amount of accounts that saw your story. This figure is an estimate.
- Impressions. The total number of views on your story (including repeat views).
Why discovery stats matter: People use Instagram to discover brands. And 62% of people surveyed by Facebook say they’re more interested in a brand or product after seeing it in Stories.
Compare reach and impression numbers to your follower count to gauge how much of your audience is watching your Stories.
Instagram Story analytics: Navigation metrics
- Forward Taps. Number of times someone tapped to the next story.
- Back Taps. The number of times someone tapped back to see the previous story.
- Next Story Swipes. The number of times someone swiped to the next story.
- Exit Story Taps. The number of times someone exited your story.
Why navigation stats matter: Navigation metrics show you what’s working and what isn’t. If a lot of viewers exit or skip to the next story, it’s a not-so-great sign that your content isn’t capturing attention. Back taps, on the other hand, suggest your story shared content or info people wanted to see twice. If a story’s earned a lot of repeat views, it may be a good one to save to your Instagram Story highlights.
Instagram Story analytics: Interactions metrics
- Likes. The number of people who gave your Story a like.
- Profile Visits. The number of times your profile was viewed by someone who viewed your story.
- Replies. The tally of people who responded to your story.
- Follows. Number of accounts that followed you after viewing your story.
- Shares. The number of times your story was shared.
- Website visits. The number of people who clicked the link in your profile after watching your story.
- Link Clicks. The number of people who followed your link sticker.
- Business Address Taps. The number of times your business address was tapped by someone who viewed your story.
- Interactions. The total count of actions people took after viewing your story.
Why interaction stats matter: If your goals include a higher engagement rate or other measures, interaction stats help you gauge your success in achieving them. If your goal is to get more followers, compare Profile Visits with Follows. Did you want your story to drive traffic to your website? Website visits will show you how it fared.
4 Instagram Story metrics you can track in Hootsuite
Hootsuite isn’t just a great tool for scheduling your Instagram Stories. The dashboard can also help you collect and analyze your metrics. Use the Hootsuite Analytics tool to crunch the following numbers:
- Story exits. How many people exited your Story
- Story replies. How many people responded to your Stories in a given time frame.
- Story taps back. How many times did a viewer tap to view the previous Story?
- Story taps forward. How many times did a viewer tap ahead to the next Story?
These navigation-based metrics can show how engaged people are with your content. Are they going back for more? Are they bouncing out of here as quickly as possible?
Use their comings and goings to inform your Instagram Stories content strategy. Ideally, replies and taps back should be high, while exits and taps forward should be lowww.
Beautiful reports. Clear data. Actionable insights to help you grow faster.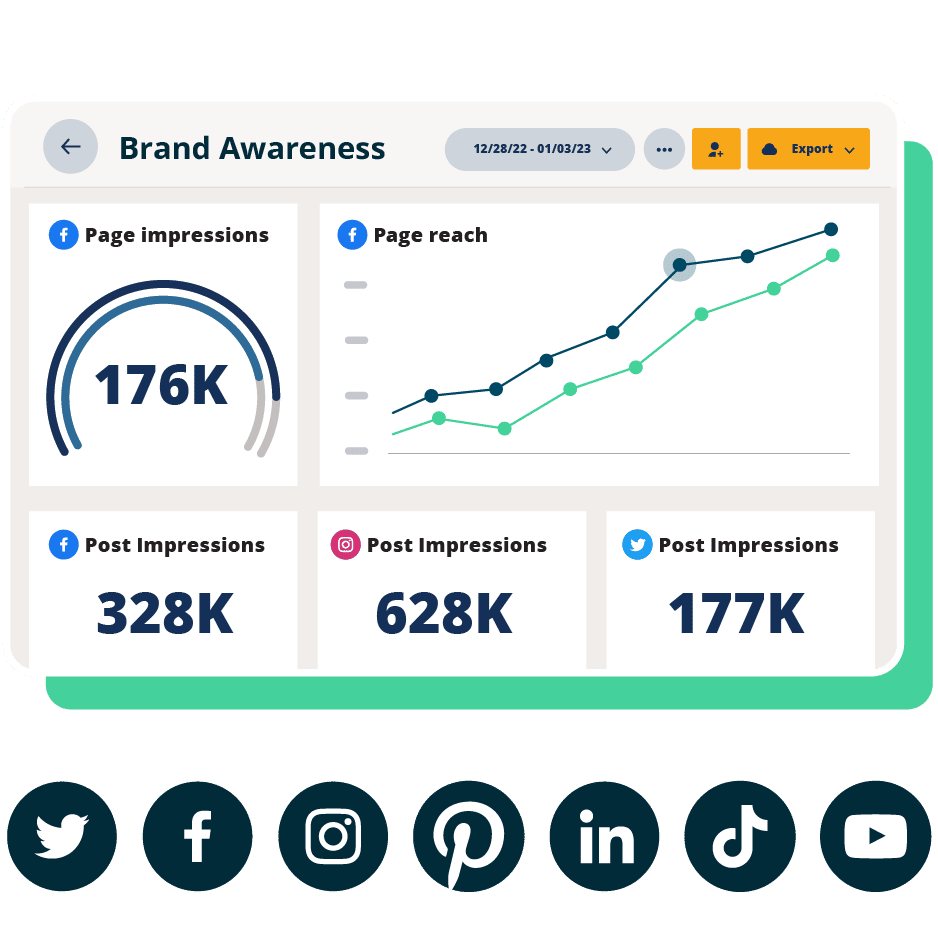
Effective tips to optimize Instagram Story analytics
Here’s how to use Instagram Insights to inform a great Instagram Stories content strategy.
Learn what works (and what doesn’t!)
Understanding your Instagram Stories performance over time will help you pinpoint top-performing posts. If you spot photos and videos that outshine other Stories, look for ways to recreate them.
Pop-up wine bar Vin Van knows its followers love wine reccos, so that’s the type of content it shares between events.

On the flip side, don’t panic if something flops. Stories are an ideal place to experiment and learn. Fortunately, if an idea doesn’t take off, it’s not on your feed forever.
Need some inspiration? Check out our top Instagram Stories ideas.
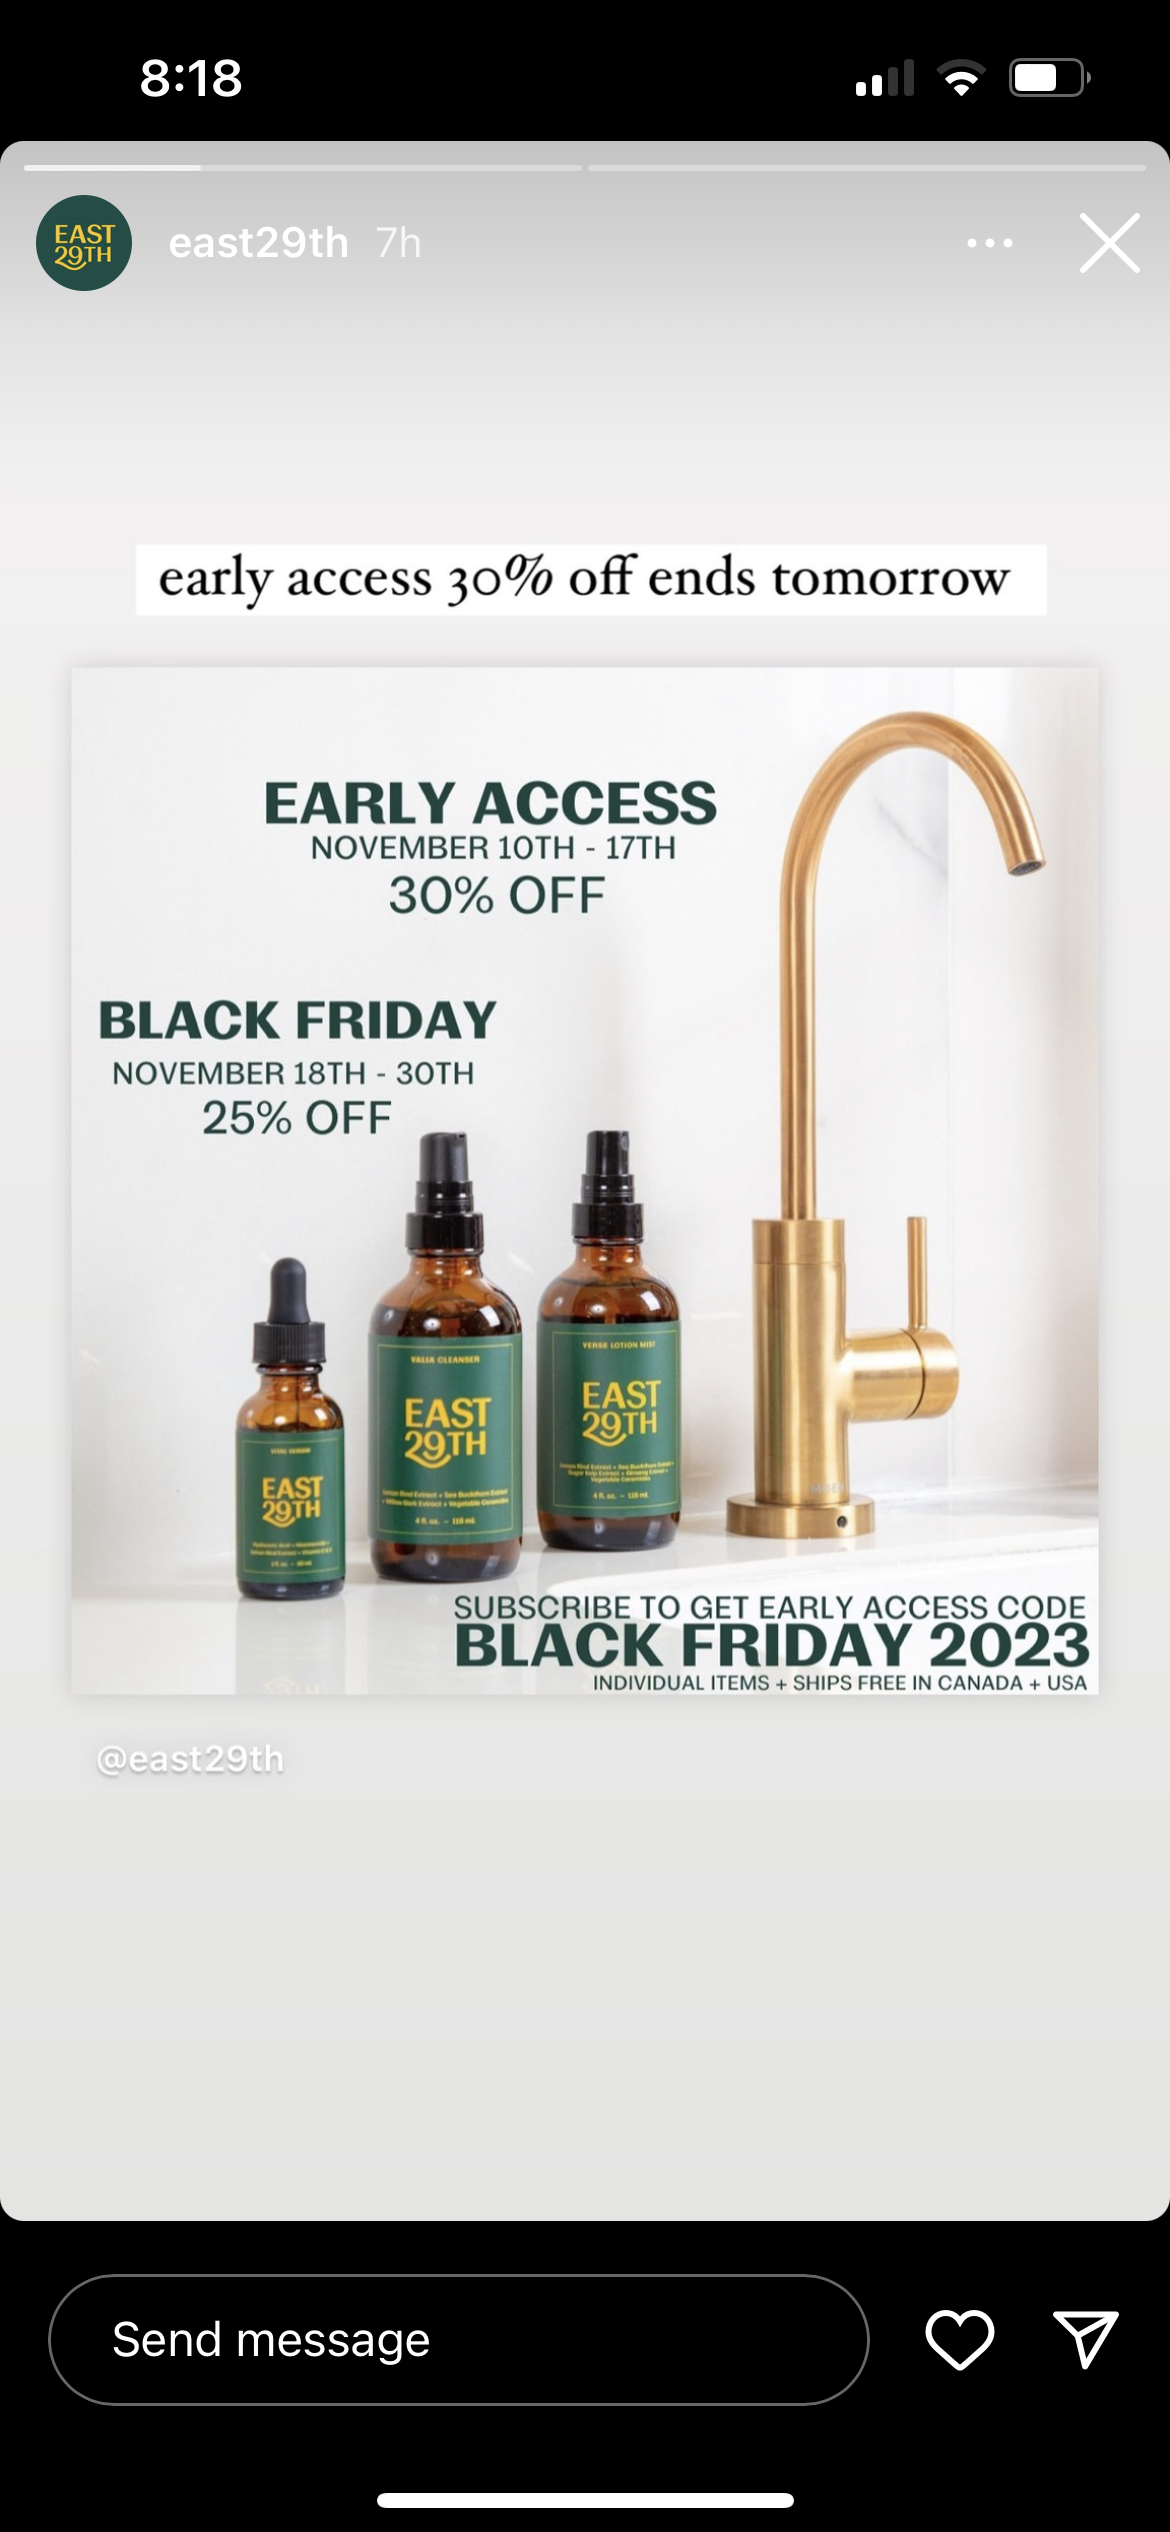
Master the art of the call to action
Stick with one clear call to action that aligns with your goals. Emphasize your CTA with branded stickers or creatives that hammer that action home.
Skincare brand East 29th makes it crystal-clear what you should do when you see this Story: subscribe to get a great deal.
Listen to audience feedback
Qualitative data is just as important as quantitative. If you’re using poll, quiz or question stickers to engage your audience, pay attention to responses.
Use feedback to inspire new products, services or content. And don’t be afraid to ask directly. People like having their voices heard.
Don’t ignore Replies, either. If people are sliding into your DMs, it may be time to organize your Instagram Inbox. Hootsuite Inbox is a great way to keep track of all your correspondence from across your social platforms in one place.
Use stickers to boost discoverability
Add stickers to boost the discoverability of your Stories. When you use a hashtag or location sticker, your story is more likely to appear in Explore or the sticker’s larger story.

Experiment with new features
Keep pushing the boundaries and exploring what’s possible with the medium. For instance, woodworking shop Union Wood Co. shared one of its Reels via Stories. Stories have some interesting editing features and filters, and new types of stickers are always dropping.
Stand out from the rest of the Stories in your followers’ by mastering all the best Instagram Story hacks and watching for fresh new ways to engage.

Schedule your Stories for when your followers are online
Stories only stay up for 24 hours, so timing your uploads is crucial to maximize your reach. To learn when your followers are online, head into your Insights on the Instagram app and tap Total followers.
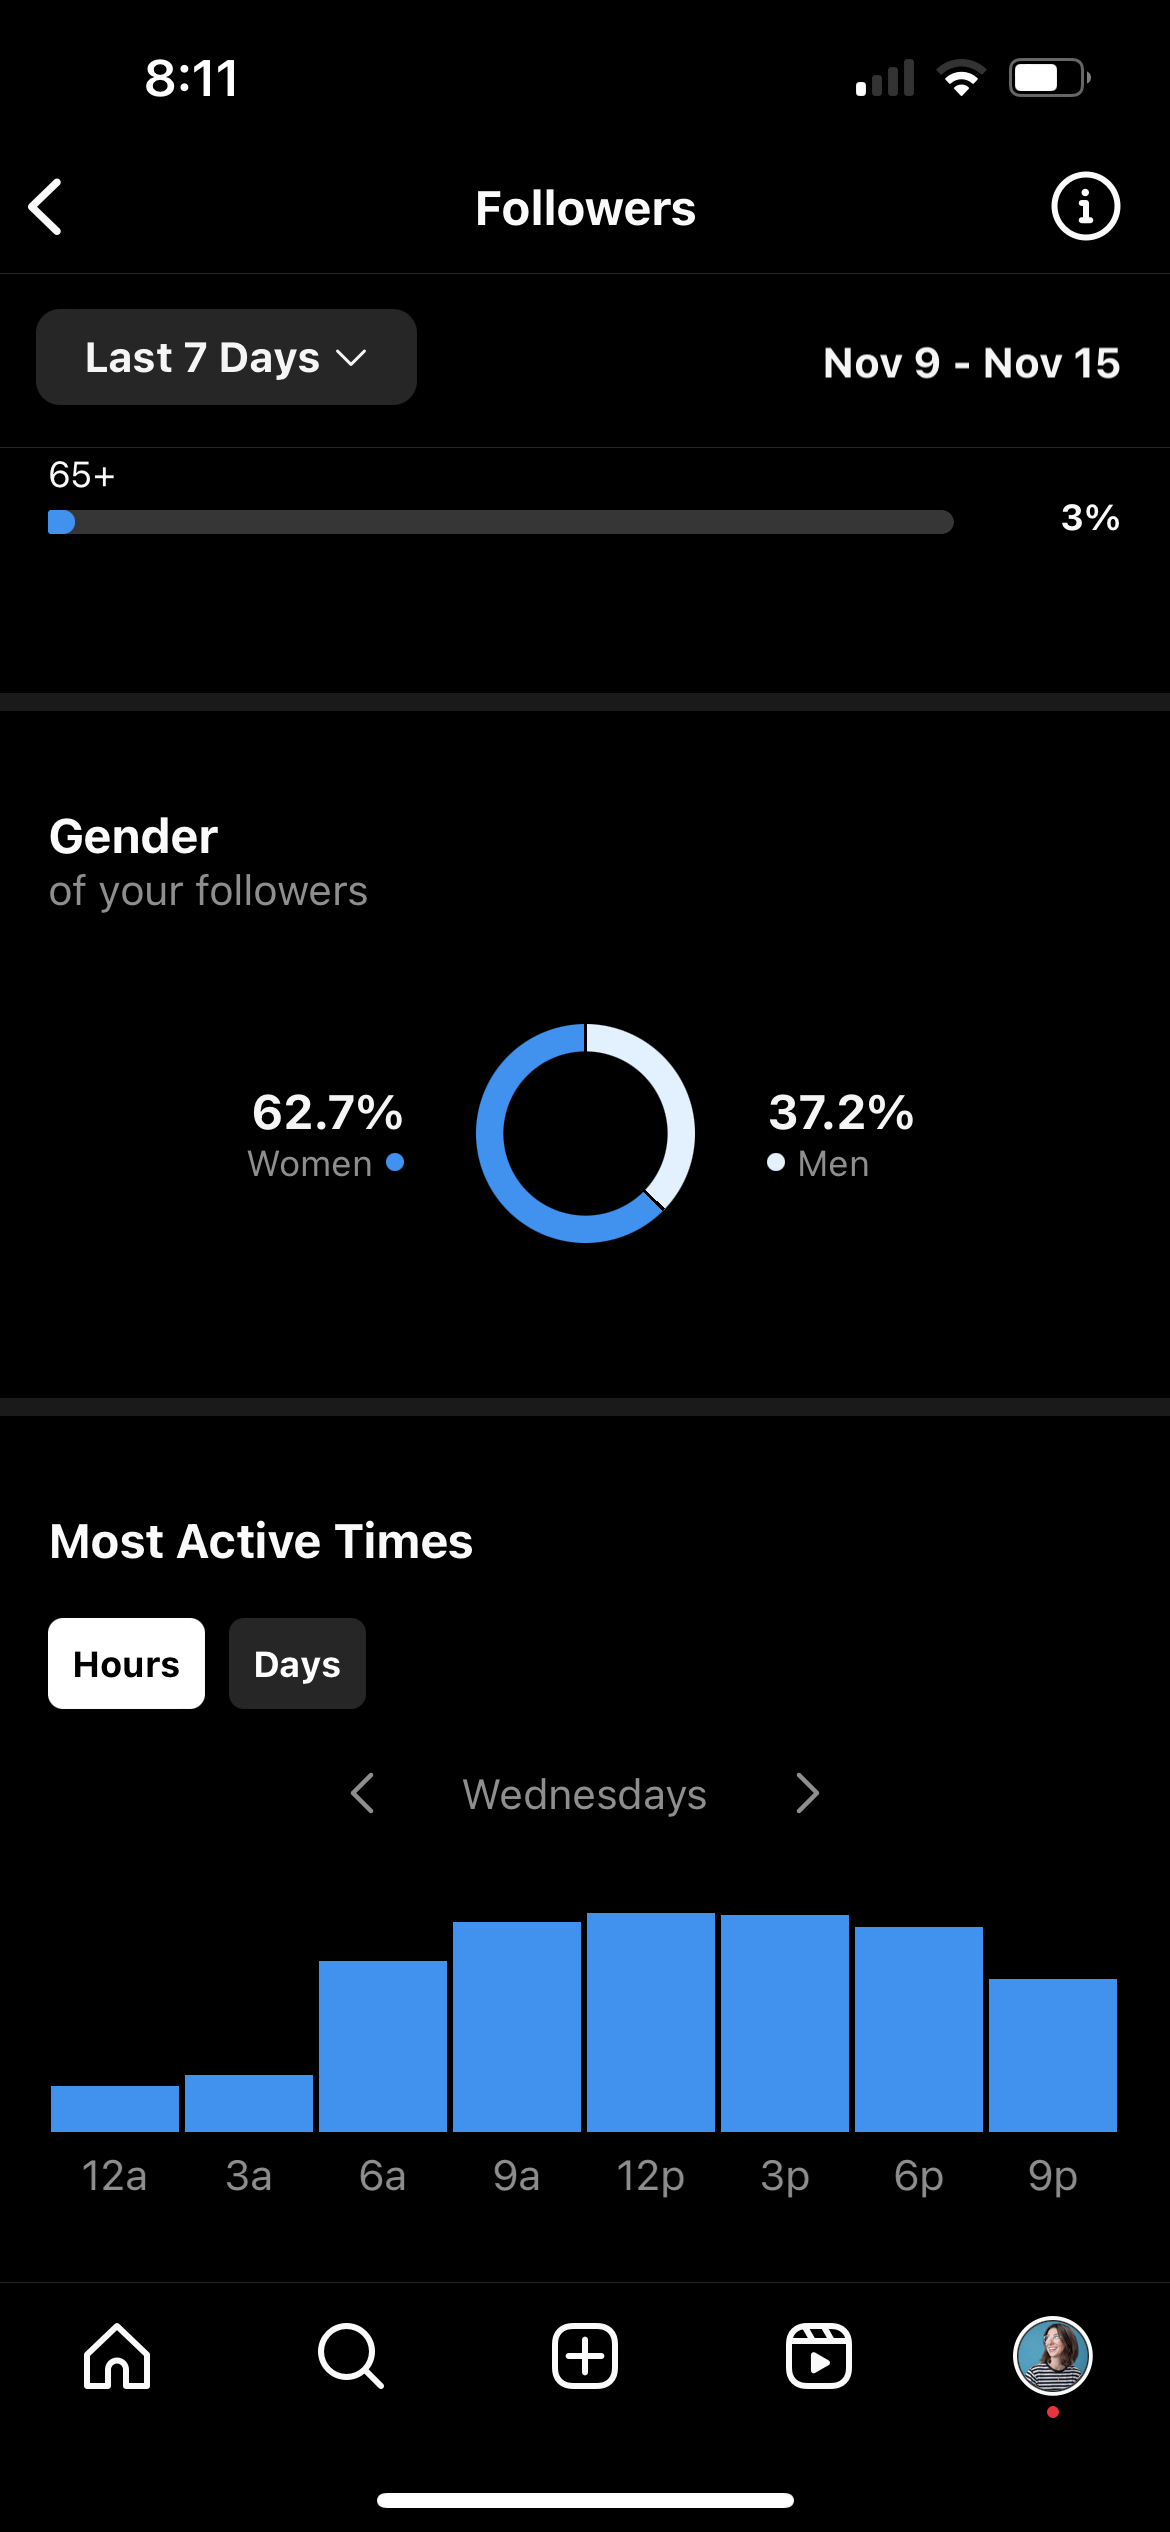
This will bring up all sorts of interesting insights about your audience’s demographics. If you scroll to the bottom, you’ll see their most active times and dates.
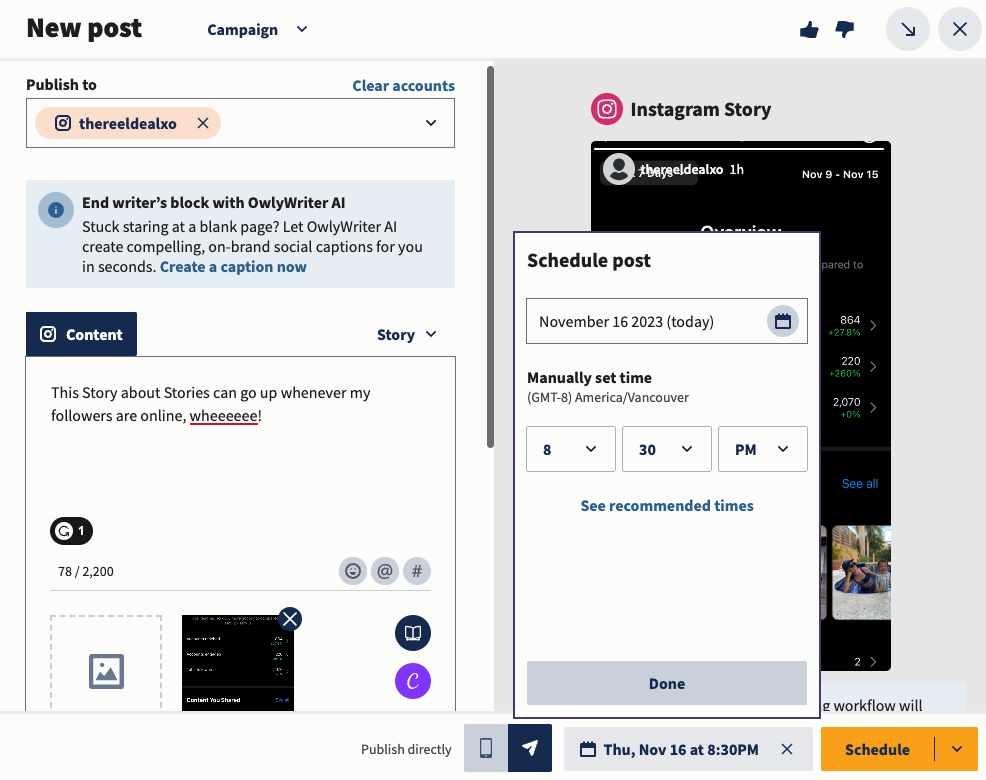
With that info, you can easily schedule your Instagram Stories with Hootsuite to go up at primetime.
So that’s the story on Stories! We’ll leave you to your number crunching and data mining. But when you’re ready to dive into the wider world of Instagram analytics, we’ve got you covered with our Instagram analytics tool primer.
Manage your Instagram presence alongside your other social channels and save time using Hootsuite. Schedule and publish posts and Stories, edit images, and measure performance — all from one simple dashboard. Try it free today.