Table of Contents
Key takeaways
- Social media metrics are the data points that show whether your content, campaigns, and strategy are actually working.
- Engagement metrics signal that your content resonates. Likes, comments, shares, saves, and engagement rate indicate that your audience is connecting with your content, and influence how algorithms distribute your posts.
- Conversion and ROI metrics connect social to results. CTR, conversion rate, CPC, CPM, and ROAS show how social activity drives business outcomes like sign-ups, sales, and ad efficiency.
- The metrics that matter most depend on your goals. Map each metric to a specific objective so you’re measuring progress, not just activity.
Social media metrics are data points that measure how well your social media strategy is performing across platforms. They measure how people discover your content, interact with it, and take action, across both organic and paid activity.
Social media metrics help you measure:
- Engagement: Does the content resonate?
- Awareness: How do people see your content? And how far does it travel?
- Conversions: Does the content motivate action?
- Growth: Is your audience expanding over time?
- Paid performance: Are your ads generating an efficient return?
- Customer experience: How well are you supporting people through social?
They’re often mixed up with KPIs, but here’s the difference: metrics measure what happened, while KPIs tie those results back to specific business goals. Impressions and likes are metrics. A goal like “grow qualified leads from Instagram by 15% this quarter” is a KPI, and you’d use metrics to track your progress toward it. Every KPI is built on metrics, but not every metric is a KPI.
Which metrics you prioritize often follows how you plan your content.
A common approach is the 70/20/10 rule: 70% of your posts deliver value to your audience, 20% share content from other sources, and 10% are directly promotional. That mix shapes what you measure. Value-driven posts lean on engagement and reach metrics, while promotional posts lean on conversion and paid metrics.
Tracking social media metrics helps you make better decisions about your content, spend, and strategy.
Social media metrics help you:
- Evaluate your performance. Metrics are like scorecards for your content. They show which posts resonate and which ones miss, so you can optimize your content strategy over time.
- Make smarter strategy decisions. Social media metrics reveal trends in engagement, reach, and growth, and that info can help you adjust your posting times, formats, and channels in real time.
- Connect social activity to business results. The right metrics show how social contributes to website traffic, sign-ups, revenue, and other business goals, making it easier to justify the time and spend.
- Spot problems earlier. Metrics make it possible to identify downward trends, like declining engagement or reach, before they snowball into bigger issues.
- Benchmark against competitors. Metrics let you compare your performance to competitors and your wider industry, so you know whether you’re keeping pace or falling behind.
This isn’t about vanity metrics. Strategic social media planning requires consistent measurement to guide decisions and prove impact, especially when revenue growth remains the top CMO priority.
The social media metrics that matter most are the ones that support your goals.
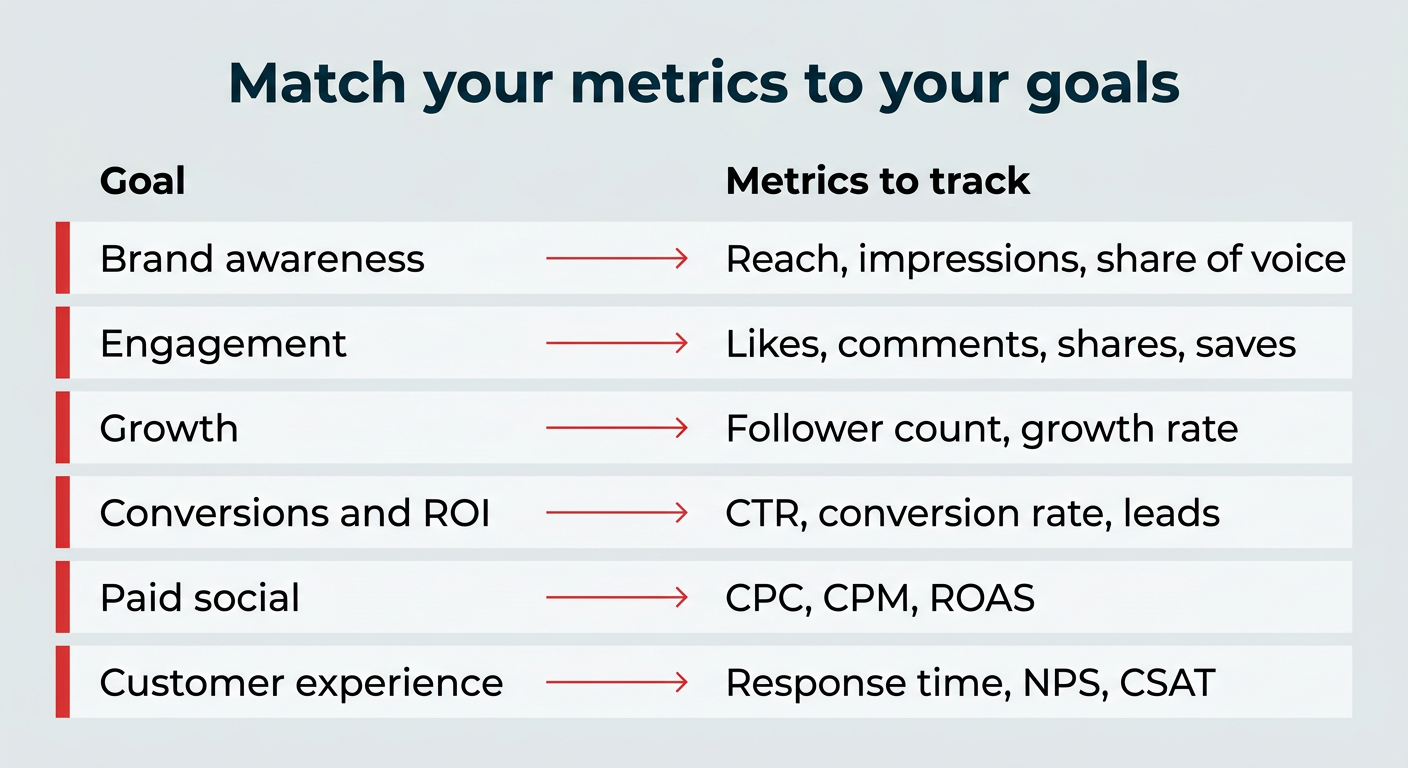
Instead of tracking everything, narrow down your primary goals, then focus on the metrics that show your progress toward them. Here’s a handy cheat sheet:
| Goal | Metrics to track |
|---|---|
| Brand awareness | Reach, impressions, and share of voice |
| Engagement | Likes, comments, shares, saves, and engagement rate |
| Growth | Follower count and follower growth rate |
| Conversions and ROI | Click-through rate (CTR), conversion rate, sign ups, downloads, and leads |
| Paid social performance | Cost per click (CPC), cost per thousand impressions (CPM), and return on ad spend (ROAS) |
| Customer experience | Average response time, net promoter score (NPS), customer satisfaction (CSAT), and sentiment |
Organic posts lean on engagement and reach, while paid campaigns (now claiming close to 32% of U.S. digital ad spending) bring CPC, CPM, and ROAS into focus. Before you report, get your team to agree on shared definitions for each metric so everyone reads the numbers the same way.
Once you know your social media goals, the easier it is to focus on the metrics that matter. Keep reading for a complete list of the essential social media metrics to track in 2026.
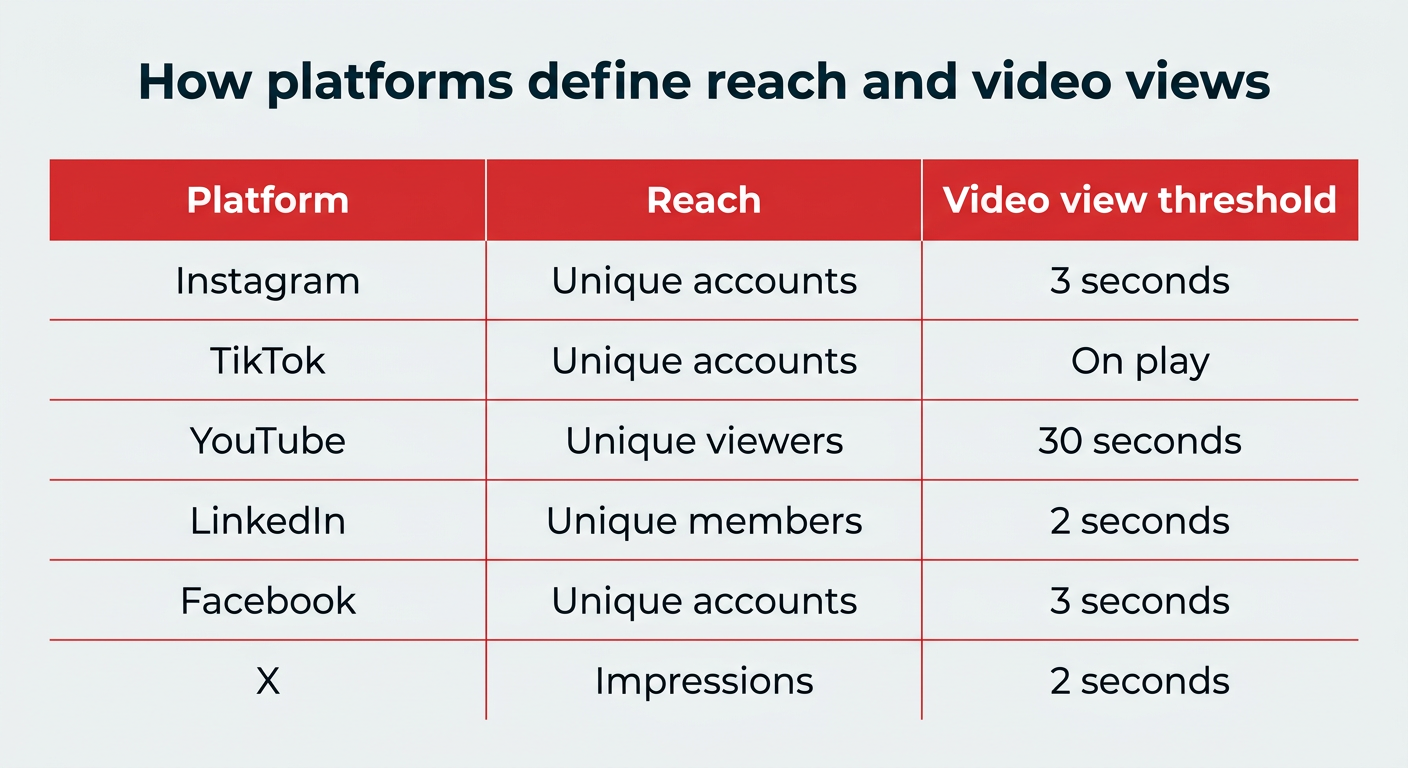
The same metric name can mean very different things depending on the platform. A “view” on YouTube and a “view” on TikTok aren’t measuring the same behavior, and reach is calculated differently on Instagram than on LinkedIn. If you’re comparing numbers across channels without knowing these differences, you can draw the wrong conclusions fast.
Here’s how a few key social media metrics are defined across the major platforms:
| Platform | How reach is defined | Video view threshold |
|---|---|---|
| Unique accounts that saw your content | At least 3 seconds | |
| TikTok | Unique accounts that saw your content | As soon as the video starts playing |
| YouTube | Unique viewers | At least 30 seconds |
| Unique members who saw your content | At least 2 seconds with 50% of the video in view | |
| Unique accounts that saw your content | At least 3 seconds | |
| X (Twitter) | Reported as impressions, not unique reach | At least 2 seconds with 50% of the video in view |
Engagement rate calculations vary too. Some platforms and tools calculate it against followers, others against reach or impressions. That’s why the same post can show two different engagement rates in two different tools. The takeaway: always confirm how a platform defines a metric before you benchmark or report on it.
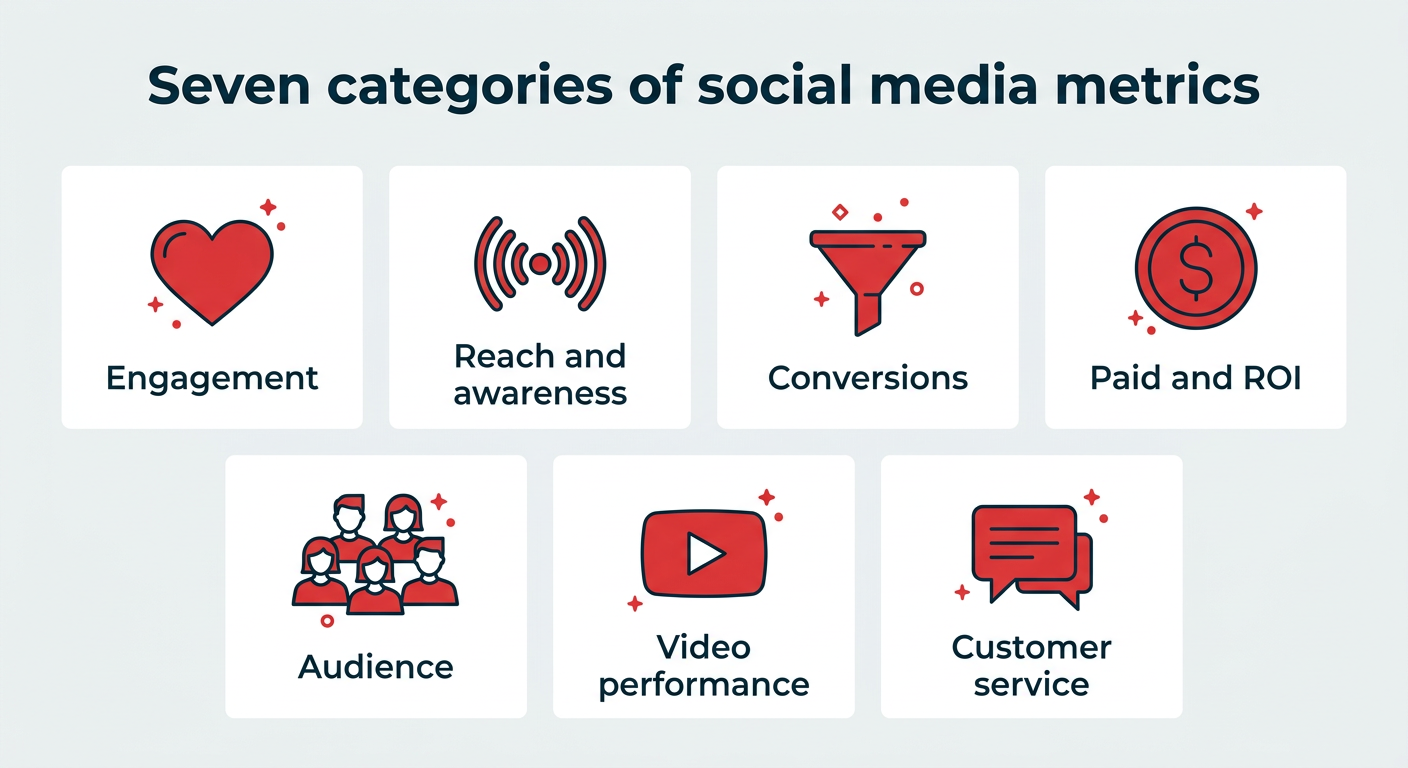
We’ve broken down the 25 key social media metrics you need to keep an eye on. Follow along to gain a better understanding of each metric and learn how to track it.
- Engagement metrics
- Reach and awareness metrics
- Conversion metrics
- Paid social and ROI metrics
- Audience metrics
- Video performance metrics
- Customer service metrics
Engagement metrics
Engagement metrics show how often people interact with your content and how strongly it resonates with your audience.
High social media engagement is an obvious telltale that people like your content, but it also puts you in favor with many social media algorithms, which can push your reach even further.
1. Engagement rate
Engagement rate shows how strongly your content resonates relative to your audience size. It’s one of the most reliable indicators of whether your content is actually connecting, not just getting seen.
There are multiple ways to calculate engagement (in fact, we have a dedicated article on all the ways to do it), but here’s one of the most common formulas:
Engagement rate formula: (Total likes + comments + shares + saves) ÷ total followers × 100

Note: If you’re calculating engagement for your entire account, be sure to include data from all published posts.
For specific marketing campaigns, only include the social media posts tied to that campaign. If you want to skip the math (we don’t blame you), you can also use our free engagement rate calculator to measure engagement by post, account, or campaign.
Pro tip 💡: This metric is most useful when you stack it up against benchmarks. Engagement rates can swing a lot depending on the platform, industry, and audience size. Take a look at engagement rate to see how yours stacks up.
2. Likes and reactions
Likes and reactions show how often someone paused mid-scroll to interact with your post. While they’re sometimes called vanity metrics, they still play a big part in giving you a quick read on what’s landing.
For example, on platforms like Facebook and LinkedIn, reactions can help you gauge actual sentiment about each post. Are people laughing? Do they support your content? The specific reaction types (love, laughing, angry, and so on) work as lightweight sentiment signals that tell you how people feel, not just that they engaged.
At a baseline, likes and reactions show how often your content resonates enough to make someone pause and interact, even briefly. Track them over time by week or month to spot trends and make sure engagement is moving in the right direction.
3. Comments
Comments are one of the strongest signals of real engagement. Tapping “like” is easy, but taking the time to write a comment means your content sparked a thought or a question.
They also give you valuable feedback. Comment sections are often full of ideas, objections, and insights from your audience.
Trish Riswick, former Social Media Manager at Hootsuite, echoes this: “The comment section is filled with inspiration and feedback, but it’s also a great metric to track as it demonstrates the effectiveness of your posts and the increase in love from your followers.”
Pro tip 💡: Track comment volume over time to spot growth. As your audience becomes more invested in your brand, you should see more conversation showing up under your posts.
4. Shares
Shares are the number of times people send your content to others. Depending on the platform, you’ll see these counted as shares, reposts, or sends.
Shares are one of the clearest signals that your content hit the right note. When someone shares a post, they’re putting their name behind it and passing it along to their own circle.
As Riswick explains, “In our Consumer Report, we asked why people share content on social. The biggest reason was because people agreed with the post. Respondents also said they shared something because they found it informative or because a post was inspirational.” That insight still holds: people share content they agree with or learn from.
Keep track of how many shares your content gets over a certain time period to make sure it’s growing. If you ever see a drop in shares, go back to see what type(s) of content receive the most shares, and create more of that content.
5. Saves and save rate
Saves are the number of times people bookmark your content to return to it later. You’ll see them called saves on Instagram and TikTok and bookmarks on X.
Saves are one of the highest-intent engagement signals you can track. A like takes a second, but a save means someone found your content useful enough to keep. That usually points to genuinely valuable posts: tutorials, tips, product roundups, and reference material.
Save rate formula: (Total saves ÷ reach) × 100
Saves matter even more because Instagram’s algorithm weighs them heavily when deciding how far to push a post. If a piece of content earns a high save rate, that’s a strong sign to make more like it.
Reach and awareness metrics
Reach metrics show how many people see your content and how much attention your brand gets on social media.
These are important metrics to pay attention to because they help you get an idea of how large your online audience is.
6. Reach
Reach measures how many people see your content, giving you a read on the true size of your audience.
It’s a good idea to track both your average reach and the reach of each post, story, and video you publish. You can also measure your account’s overall reach.
Keep in mind that reach is defined differently depending on the platform. Instagram counts unique accounts reached, while LinkedIn counts unique members. (See the platform comparison table above for the full breakdown.) That’s why you shouldn’t compare raw reach numbers across channels without checking how each one measures it.
To drill down even more, look at what percentage of your reach is made up of followers vs. non-followers. If a lot of non-followers are seeing your content, that means it’s being shared or doing well in the algorithms, or both.
7. Impressions
Impressions show how often your content appears on screen, helping you understand frequency and visibility beyond unique viewers.
You can measure impressions by post, as well as the overall number of impressions on your social media profile.
Impressions can be higher than reach because they count the number of times your content is viewed, even if it’s by the same person.
An especially high level of impressions compared to reach means people are looking at a post multiple times. Do some digging to see if you can understand why it’s so sticky.
8. Social share of voice (SSoV)
Social share of voice measures how many people are talking about your brand on social media compared to your competitors. How much of the social conversation in your industry is all about you?
Mentions can be either:
- Direct (tagged, e.g., “@Hootsuite”)
- Indirect (untagged, e.g., “hootsuite”)
Essentially, SSoV is like a competitive analysis: how visible (and therefore relevant) is your brand in the market?
To calculate SSoV: Divide your brand mentions by total industry mentions (yours + competitors’), then multiply by 100.
Want to skip the math? With Perch by Hootsuite, you can monitor conversations, SSoV, keywords, mentions, and hashtags, taking the guesswork out of your marketing.
If you want to take it a step further, Lumen by Talkwalker helps you monitor conversations, keywords, mentions, hashtags, and share of voice across the social web.
9. Social search visibility
Social search visibility measures how often your brand or content shows up in search results within social platforms, like TikTok Search, Instagram Search, YouTube Search, and LinkedIn Search.
This matters more every year. A growing share of people, especially Gen Z (who use TikTok, Instagram and YouTube at rates between 79 and 91 percent), start their search on TikTok or Instagram instead of Google. When someone types “best running shoes” into TikTok Search, you want your content in those results. Tracking how your branded and topic keywords rank inside these platforms is becoming a standard part of social measurement.
To keep an eye on it, note which of your posts surface for target keywords and watch how your ranking shifts over time. Hootsuite’s social listening tools can help you monitor these signals alongside your mentions and share of voice.
Conversion metrics
Conversion metrics show how effectively your social media efforts drive desired actions, including clicks, sign-ups, and purchases.
These metrics apply to both organic and paid content, so they’re where blended tracking becomes important. Getting attribution right (paired with ROI tracking) is what lets you prove that social is contributing to your bottom line.
10. Conversion rate
Conversion rate measures how often your social content leads to a conversion (think: sign-up, download, or sale).
This is one of the most important social media marketing metrics because it shows the value of your social media campaigns (organic and paid) in feeding your funnel.
Attribution has gotten harder in 2026. With third-party cookies phased out and tighter privacy rules across browsers and platforms, tracking a user from a social post to a conversion isn’t as clean as it used to be.
UTM parameters are the most reliable way to bridge that gap, because they tag your links so you can see exactly which posts and campaigns drove the action. Learn how they work in our blog post on using UTM parameters to track social success.
To calculate conversion rate: Divide the number of conversions by the number of clicks, then multiply by 100. Most platforms report conversion rate automatically once your tracking is set up, and that’s the easier, more reliable route.
11. Click-through rate (CTR)
Click-through rate, or CTR, indicates how often people click a link or call-to-action in one of your posts. That could be anything from a blog post to your online store to a link in bio page.
CTR gives you a sense of how many people saw your social content and wanted to see more. It’s a good indicator of how well different types of content promote your brand on social media.
To calculate CTR: Divide total clicks by total impressions, then multiply by 100. That said, every major platform reports CTR right in its analytics, so we recommend pulling it from there and saving the formula for spot-checks.
For more tips on optimizing your content, check out this guide on zero-click content.
Paid social and ROI metrics
Paid social and ROI metrics measure the efficiency and return of your paid social campaigns. These are the numbers you reach for when you need to justify ad spend and show leadership what that budget is actually delivering.
12. Cost per click (CPC)
Cost-per-click, or CPC, is the amount you pay per individual click on a social ad.
Knowing a customer’s lifetime value for your business or even the average order value will help you put this number in an important context. A free ROI calculator can help you quantify it.
A higher customer lifetime value combined with a high conversion rate means you can afford to spend more per click to attract visitors to your website in the first place.
To calculate CPC: Divide your total ad spend by the total number of clicks. But you won’t usually need to: CPC is reported automatically in the analytics of whichever network is running your ad.
13. Cost per thousand impressions (CPM)
Cost per thousand impressions, or CPM, is exactly what it sounds like. It’s the cost you pay for every thousand impressions of your social media ad.
CPM is all about views, not actions.
To calculate CPM: Divide your total ad spend by total impressions, then multiply by 1,000. Or, just import the data from your social networks’ analytics.
14. Return on ad spend (ROAS)
Return on ad spend, or ROAS, is the revenue you generate for every dollar you put into social ads. It’s the metric that answers the question leadership actually cares about: is this ad spend making money?
ROAS formula: (Revenue from ads ÷ ad spend) × 100
CPC and CPM tell you how efficiently you’re buying clicks and views, but ROAS tells you whether those clicks and views turn into profit. Most ad platforms report ROAS natively once your conversion tracking is set up. Pair it with conversion rate to check whether your best-performing ads are also driving the actions you want, not just cheap traffic.
Audience metrics
Audience metrics measure who your followers are, how fast your audience is growing, and how people feel about your brand, so you can sharpen your messaging and target growth.
Here are the metrics to watch out for:
15. Follower count
Follower count is the number of followers you have on each platform. It’s a handy metric to track if you’re trying to grow your audience.
Riswick says, “What was once thought of as a vanity metric was proven by our team to be very important. We found that a significant majority of people who follow a brand on social have explicit plans to make a purchase from them soon or in the future, according to our Consumer Report.”
She adds, “Out of all the metrics, follower growth is also just a nice and quick way to see how your social media efforts are working.”
16. Follower growth rate
Your follower growth measures how many new followers your brand gets on social media within a certain amount of time.
It’s not a simple count of your new followers. Instead, it measures your new followers as a percentage of your total audience.
So, when you’re just starting out, getting 10 or 100 new followers in a month can give you a high growth rate. But once you have a larger audience, you need more new followers to maintain that momentum.
To calculate follower growth rate: Divide net new followers over a reporting period by your total audience, then multiply by 100.
17. Social media sentiment
Social media sentiment looks at how people feel when they talk about your brand online. Beyond likes and comments, sentiment shows whether the conversation is positive, negative, or somewhere in between.
Calculating social sentiment requires some help from a sentiment analysis tool that can process and categorize language and context. We’ve got a whole post on how to measure sentiment effectively.
18. Demographics
Audience demographics are data points that describe who your followers are, including age, gender identity, location, and when they’re most active online.
In 2026, platforms surface more than the basics. You can also tap into psychographic and behavioral data: interests and purchase behavior on Meta, job titles and industries on LinkedIn, and content preferences on TikTok. That extra layer helps you understand not just who your audience is, but what they care about and how they behave.
Demographics can help inform your strategy, find the right times to post, and direct your marketing messaging. Hootsuite surfaces these demographic insights in Perch analytics, so you can see them across all your connected accounts in one place.
Video performance metrics
Video performance metrics measure how people watch and engage with your video content across social platforms.
Posting video content on YouTube and other social media channels? You’ll need to pay attention to these video-specific KPIs.
19. View count
View count is the number of times people watched your video, based on each platform’s minimum watch-time threshold.
Here’s how the major platforms define it:
- YouTube: At least 30 seconds (YouTube Shorts count a view as soon as playback starts)
- Facebook: At least 3 seconds
- Instagram: At least 3 seconds
- TikTok: As soon as your video starts playing
View count works best as a quick pulse check. It tells you how many people stopped scrolling long enough to give your video a chance.
20. Video completion rate
Video completion rate measures the percentage of viewers who watch your video all the way to the end.
Video views are great, but they only tell you that someone started watching. Completion rate tells you whether your content held their attention, a strong sign you’re connecting with your target audience and a positive signal to many social media algorithms.
To calculate video completion rate: Divide the number of completed views by the total number of video views, then multiply by 100. You’ll also find video completion rate in each platform’s native analytics.
21. Watch time
Watch time refers to the total time viewers spend watching your video content.
It’s one of the clearest signals of real interest, telling you whether viewers are watching all the way through or dropping off early. Tracking watch time over time helps you spot what holds attention and what’s helping your video performance grow.
You’ll find watch time in each platform’s native analytics: YouTube Studio, Instagram Insights, and TikTok Analytics all report it.
Pro tip 💡: Track average watch time alongside the total to see how long a typical viewer sticks around (and where they drop off).
Customer service metrics
Customer service metrics show how well your team responds to and supports customers through social channels. Take a look at the following customer service metrics:
22. Average response time
Response time is a metric that measures how long it takes for your customer service team to respond to queries that come via social channels, mainly through your social inbox.
Using AI customer service bots can significantly reduce response time for many repeat requests. If you’re using a social customer service tool like Nest by Hootsuite, you can add response time directly to your analytics report.
Otherwise, you can calculate it manually by adding up the total time taken for an initial response to customer queries and dividing it by the number of queries.
23. Customer satisfaction (CSAT) score
CSAT (customer satisfaction score) is a metric that measures how happy people are with your product or service.
Usually, the CSAT score is based on one, straightforward question: How would you rate your overall level of satisfaction? In this case, it’s used to measure the level of satisfaction with your social customer service.
It’s why so many brands ask you to rate your experience with a customer service agent after it’s over. And that’s exactly how you can measure it, too.
Create a one-question survey asking your customers to rate their satisfaction with your customer service and send it via the same social channel used for the service interaction. This is a great use for bots.
To calculate CSAT: Divide the number of satisfied customers (those who answered 4 or 5 on a 5-point scale) by the total number of responses, then multiply by 100.
24. Net promoter score (NPS)
Net promoter score, or NPS, is a metric that measures customer loyalty.
Unlike CSAT, NPS is good at predicting future customer relationships. It is based on one (and only one) specifically phrased question: How likely are you to recommend our [company/product/service] to a friend?
Customers are asked to answer on a scale of zero to 10. Based on their response, each customer is grouped into one of three categories:
- Detractors: 0–6 score range
- Passives: 7–8 score range
- Promoters: 9–10 score range
NPS is unique in that it measures customer satisfaction as well as the potential for future sales, making it a valuable go-to metric for organizations of all sizes.
To calculate NPS: Subtract the percentage of detractors from the percentage of promoters. (Or: promoters minus detractors, divided by total respondents, times 100.)
25. Referral traffic from social
Referral traffic from social is the number of website visitors who arrive by clicking a social media link. It’s a bridge metric, connecting your social activity directly to website-level business outcomes.
Google Analytics (or your equivalent web analytics tool) is the primary place to track it. Layer in UTM parameters on your tracked social links and you can pinpoint which platforms, campaigns, and posts are actually sending people to your site. Watch referral traffic over time to see whether your social efforts are driving meaningful visits, not just on-platform engagement.
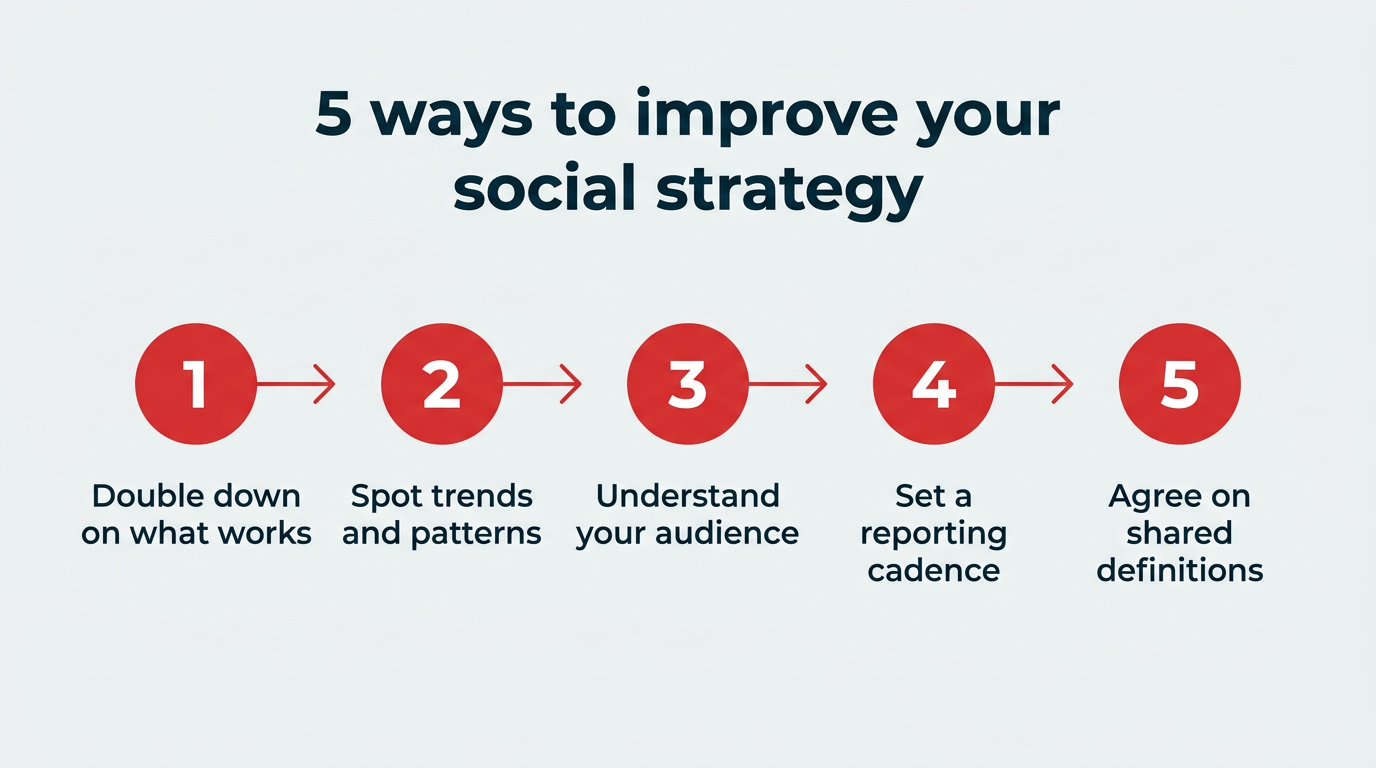
To use social media metrics to improve your strategy, turn what you measure into next steps. Here are five moves that matter most:
- Double down on what works. Your metrics pinpoint which content types and topics your audience responds to. Make more of what earns reach and engagement, and less of what misses.
- Spot trends and patterns. If a certain product, format, or topic consistently gets more attention (especially one aligned with emerging social trends), promote it more often (and consider testing fresh spins on it).
- Understand your audience. Read and respond to comments, watch which content takes off, and track brand mentions to learn what your audience actually wants.
- Set a reporting cadence. Review tactical metrics weekly so you can adjust quickly, pull together strategic reports monthly, and roll up the big picture for leadership quarterly. A consistent rhythm keeps you from reacting to noise and helps you see real trends.
- Agree on shared definitions. Make sure everyone on your team interprets each metric the same way. When one person’s “engagement rate” is calculated against followers and another’s against reach, your reports stop being comparable. Write the definitions down and stick to them.
Then feed it all back in. Your social media marketing strategy should keep evolving based on your analytics. Measurement is the input for the next round of experiments. A strategy template can help you structure that feedback loop so your results compound over time.
Tracking the right metrics is what lets you grow your presence faster, increase your social media ROI, and turn day-to-day data into long-term social media success.
Bonus: Get a primer on social strategy and measurement from our free ebook on social media marketing basics.
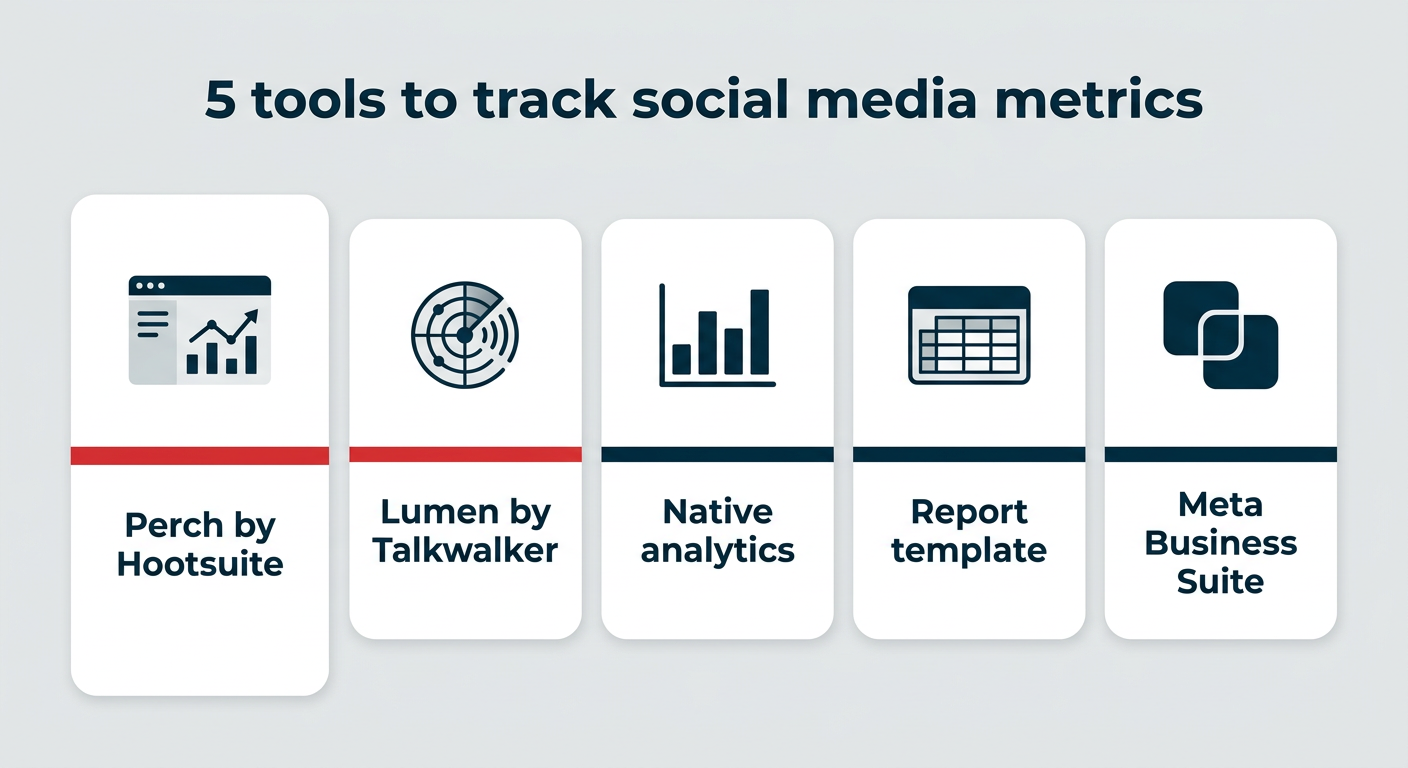
Are you looking to organize all your social media metrics so that you can easily create reports for your team? Here are five helpful tools to help you organize and manage all your social metrics:
1. Native platform analytics
Every major platform gives you free, built-in analytics, and they’re the best place to start. You’ll find your core metrics reported natively across:
- Meta Business Suite (Facebook and Instagram)
- YouTube Studio
- TikTok Analytics
- LinkedIn Analytics
- X Analytics
The catch: you have to log into each one separately and stitch the numbers together yourself. That’s manageable with one or two channels, but it gets painful fast once you’re managing several. That’s where a unified tool earns its keep.
2. A social media report template
First, if you’re a spreadsheet lover, why not just own it? There’s nothing wrong with using a basic spreadsheet and social media report template to manually track your stats and autofill formulas you’ve set up.
With your own tracking spreadsheet, you’ll want to include:
- Each metric you choose to track
- Each individual platform you’re tracking
- Graphs that help visualize growth
Or, give yourself a head start by downloading our free social media analytics report template. Simply fill in the blanks – it’s really that simple.
3. Perch by Hootsuite
Perch helps you track social media metrics and compile them into digestible reports.
Here’s how to use Perch to set up a social media metrics dashboard that calculates and measures your metrics for you.
- Log in to your Perch dashboard and head to the My reports under Analytics.
- Click Create a new report. Scroll through the various reporting options and templates to create a custom report template based on the metrics you care most about. Note: once you add these metrics to your social media metrics dashboard, you don’t need to remember the formulas anymore because Perch will calculate them for you.
- Select the Benchmarking category, then Cross network competitors overview. Choose your social profiles and add competitors to compare your performance to the competition.
- To benchmark your performance against your industry as a whole, navigate back to your Perch dashboard. Click Explore under Analytics, then Industry.
- Track your social media customer service metrics using the Team Activity tab.
Meet the Suite
Understand what matters, decide what to do next, and take action across every social workflow — all from one connected suite.

4. Lumen
Lumen by Talkwalker is a consumer intelligence platform that you can use with your Hootsuite account.
With Lumen, you get advanced social listening features so that you can monitor your brand mentions and sentiment across a number of online platforms and publications.
This can be hugely helpful for both your audience and customer service metrics. Make sure you have a finger on customer sentiment so you always know how your brand is being perceived.
5. Meta Business Suite
If you have a presence on Facebook and Instagram, Meta Business Suite is a solid free option for smaller businesses that might not yet have the budget for third-party software. As noted in the native analytics section above, connect your Facebook Page and Instagram business account to use the single Meta dashboard for your analytics, messages, and more.
FAQ: Social media metrics
What are the most important social media metrics for businesses?
The most important social media metrics for businesses are engagement rate, reach, conversion rate, return on ad spend (ROAS), and follower growth. Engagement rate shows whether content resonates, reach shows how many people see it, conversion rate and ROAS tie social activity to business results like sign-ups and sales, and follower growth tracks how your audience expands over time. That said, the right mix depends on your goals, but these cover awareness, engagement, conversions, and growth.
How do enterprises choose the right social media metrics to track?
Enterprises choose the right social media metrics by matching each metric to a specific business goal. For example, a team focused on brand awareness may track reach, impressions, and share of voice, while a team focused on conversions may track click-through rate, conversion rate, and cost per click. Ultimately, the fewer metrics you track, the clearer the story they tell, as long as each one ties to a goal.
What social media metrics matter most for measuring ROI?
The social media metrics that matter most for ROI are return on ad spend (ROAS), conversion rate, click-through rate (CTR), cost per click (CPC), and cost per thousand impressions (CPM). ROAS shows the revenue earned for every dollar of ad spend, conversion rate connects social activity directly to actions like sign-ups and sales, and CTR, CPC, and CPM show how efficiently your content and ad spend turn attention into results.
How do social media metrics differ across platforms and campaign goals?
Social media metrics differ in two ways: how each social media platform defines them, and which ones matter for your goal. For example, a “view” counts after 30 seconds on YouTube but just seconds on TikTok, so the same metric isn’t comparable across platforms (see the platform comparison section above for a full breakdown). Goals shift the focus too: awareness campaigns track reach and impressions, while conversion campaigns track CTR and conversion rate.
Vanity metrics vs performance metrics: what should brands actually track?
Brands should track performance metrics that tie to business goals, not vanity metrics that look good but reveal little. While likes and comments signal reach, they don’t always show whether content drives results. That said, some metrics that look like vanity metrics, like saves, actually signal high intent because someone bookmarked your content to return to it. Performance metrics like engagement rate, conversion rate, and click-through rate connect activity to outcomes like sign-ups and sales.
What is the 70/20/10 rule for social media?
The 70/20/10 rule is a content planning framework where 70% of your posts deliver value to your audience, 20% share content from other sources, and 10% are promotional. It helps you keep your feed balanced so you’re not constantly selling, and it also shapes which metrics you prioritize: value-driven posts lean on engagement and reach, while promotional posts lean on conversion and paid metrics.
What are the 5 most common marketing metrics?
The five most common marketing metrics are reach, engagement rate, conversion rate, click-through rate (CTR), and return on ad spend (ROAS). Together they cover the full funnel: reach shows how many people see your content, engagement rate shows whether it resonates, CTR shows how many people act on it, conversion rate shows how many complete a goal, and ROAS shows the return on your ad spend.
What is the difference between social media metrics and KPIs?
Social media metrics are data points that measure what happened (like impressions or likes), while KPIs are specific metrics tied to a business goal that define whether your strategy is succeeding. Every KPI is built on metrics, but not every metric is a KPI. For example, impressions is a metric, but “increase Instagram-driven sign-ups by 15% this quarter” is a KPI you’d track using metrics.
How often should you review social media metrics?
Most teams benefit from reviewing social media metrics weekly for tactical adjustments and monthly for strategic reporting, with quarterly reviews for executive-level performance summaries. A weekly check lets you react to what’s working right now, while monthly and quarterly reviews help you spot longer trends without getting distracted by day-to-day noise.
What is a good engagement rate on social media?
A good engagement rate depends on the platform and industry, but as a general benchmark, 1–3% is considered average and anything above 3% is strong across most platforms. According to Hootsuite benchmarking data, Instagram leads with an average engagement rate of 3.5%, followed by LinkedIn at 3.4%, so compare your numbers to platform-specific benchmarks rather than a single universal figure.
Save time managing your social media marketing strategy with Hootsuite. Publish and schedule posts, find relevant conversions, measure results, and more â all from one dashboard. Try it free today.