Table of Contents
Key takeaways
- A social media report tracks performance across platforms over a set period, helping teams measure ROI and adjust strategy with confidence
- Strong reports include goals, key metrics, performance trends, audience insights, competitive benchmarks, and clear recommendations
- Different report types serve different needs: monthly performance, campaign-specific, platform-specific, sentiment analysis, and more
- Reporting tools like Hootsuite Analytics consolidate data from every major network into a single dashboard, saving hours of manual work
A social media report is a document with an in-depth analysis of your social media marketing performance over a specific period.
Social media reports help you track your key performance indicators (KPIs), measure the success of your social media campaigns, and identify opportunities for optimization.
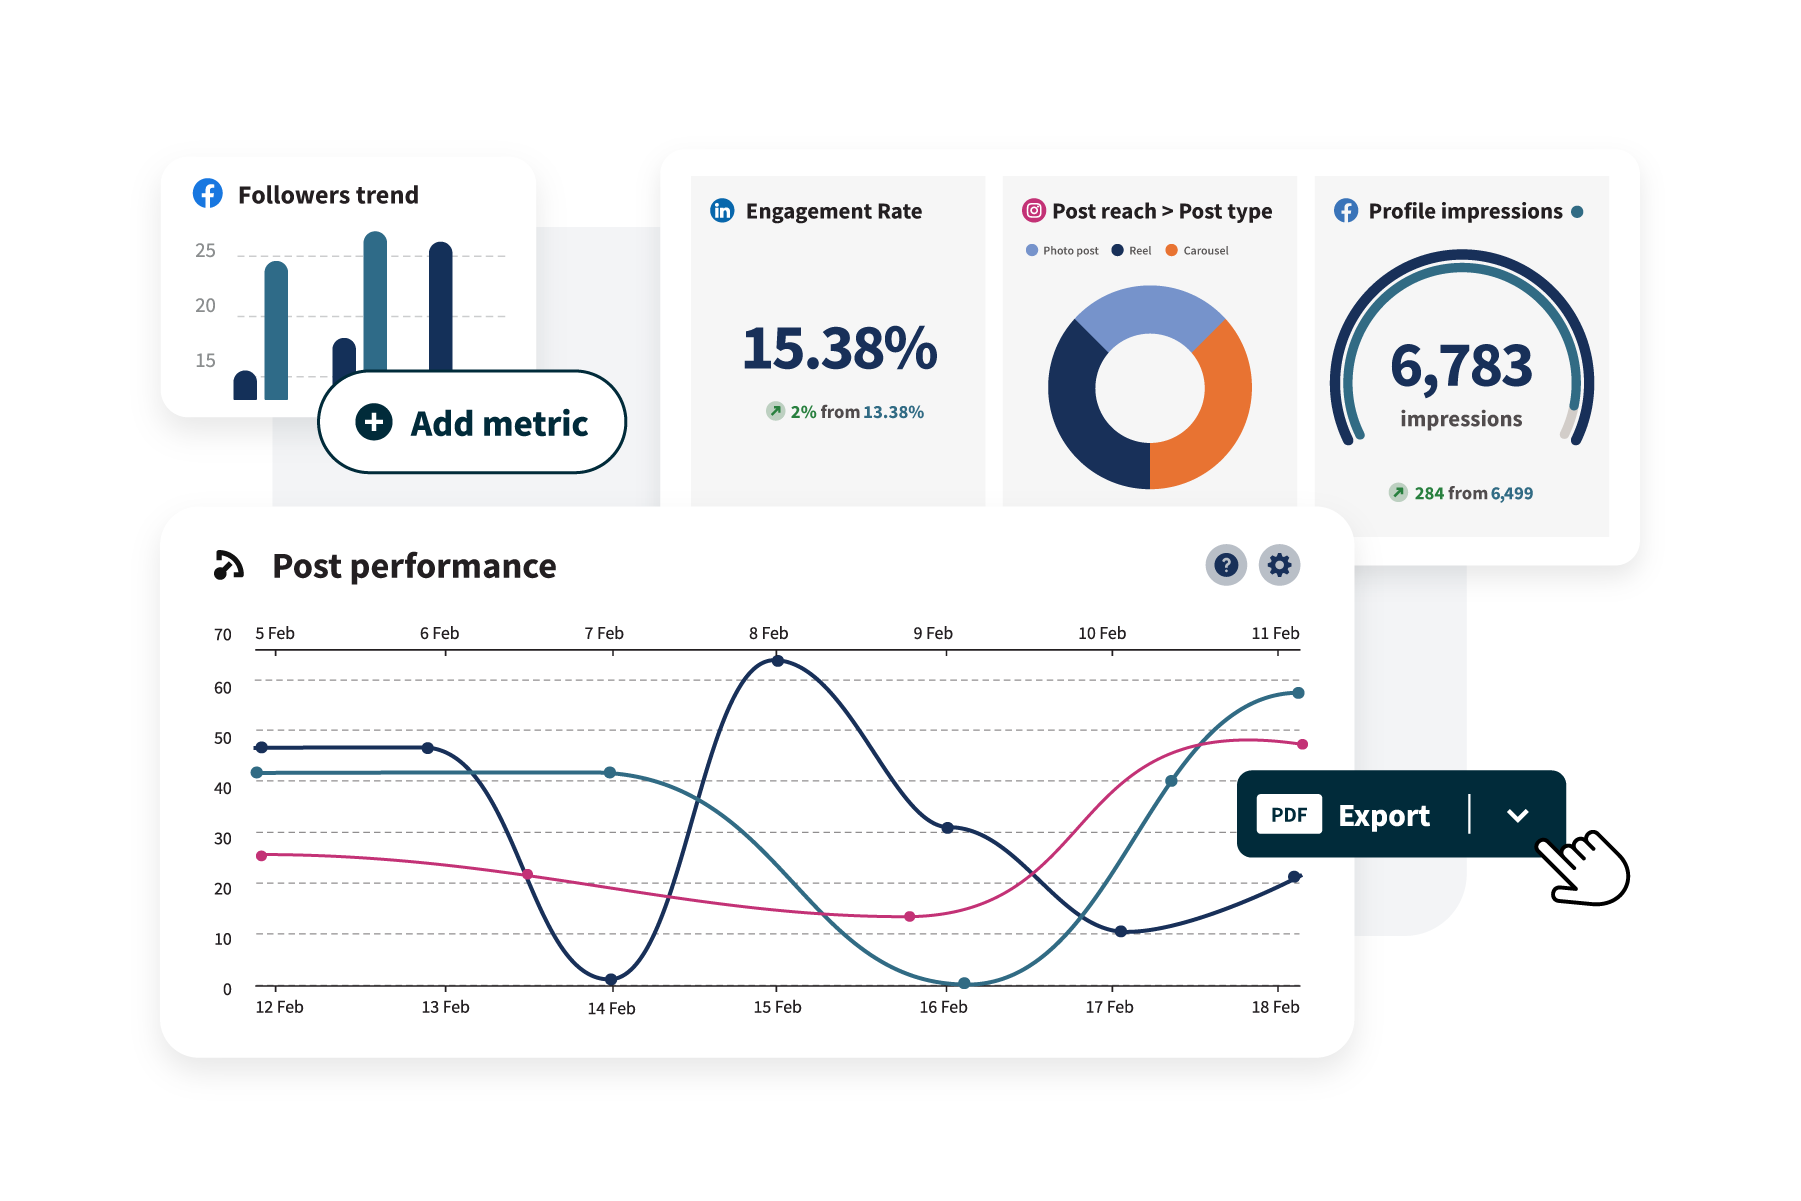
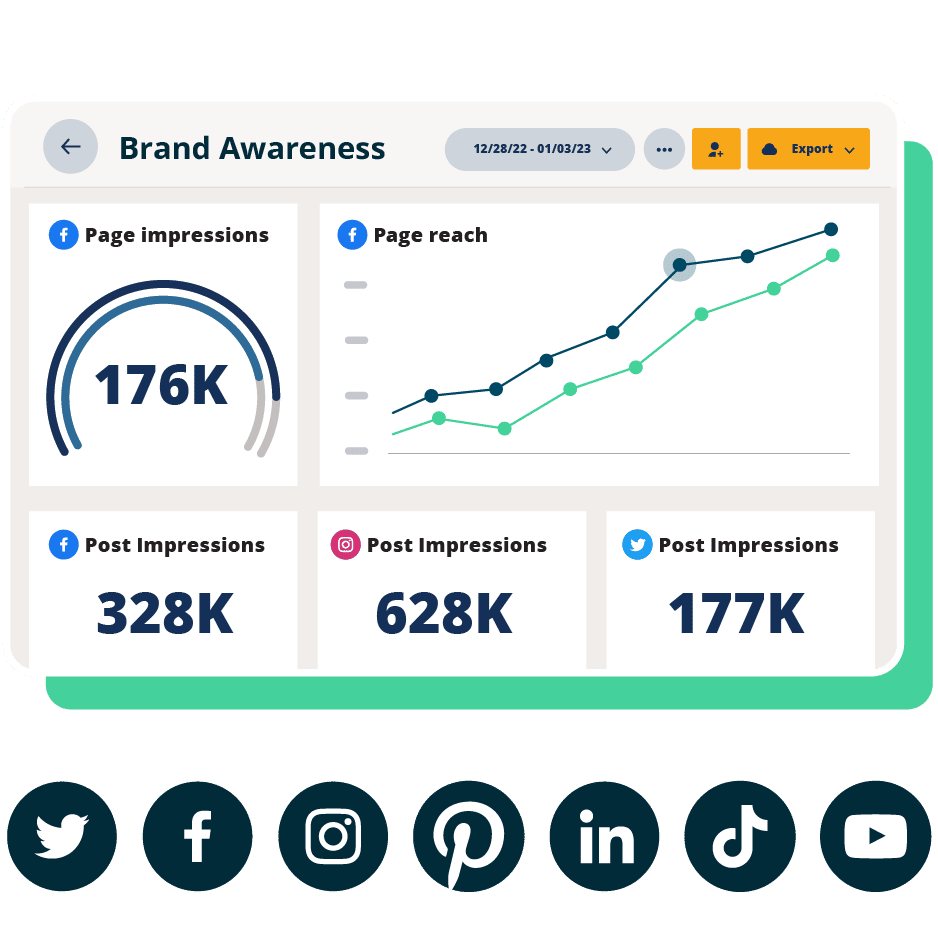
For instance, a report on your brand’s Instagram account might reveal that your followers comment more on videos than they do on photos. You might learn that your Instagram Reels are achieving a wider reach than your Instagram Carousel posts.
In other words, each data point will help you and your team identify patterns. And with these patterns, you’ll be better equipped to serve your audience more of what they like, online and offline.
A well-crafted social media report turns raw data into actionable insights that support better decision-making across your organization.
Social media reports help marketing teams understand what’s working across social media, and whether those efforts are paying off.
They make it easier to:
- Show ROI: Connect the dots between $121 billion in US social ad spending and real business outcomes
- Make data-driven decisions: Use performance data to guide strategy, campaigns, and budget
- Align teams: Give marketing, social, and leadership a shared view of performance
- Spot trends: Identify patterns in audience behavior and content performance
- Track progress: Measure results over time and test performance against goals
- Justify budget to leadership: With marketing budgets flat at 7.7% of company revenue, executives need evidence to support continued or increased investment in social
Ultimately, social media reports turn raw data into clear takeaways that support smarter planning and strategies.
A social media report should include performance metrics, insights, and context to explain results.
Most reports cover:
- An executive summary
- Social media objectives
- Period-specific goals
- Metrics and KPIs
- Performance analysis
- Campaign insights
- Competitor analysis
- Audience insights
- Content analysis
- Platform performance
- Recommendations
That said, every social media marketing report is going to be a little different, depending on your business’s unique social media goals. The list below is more of a suggestion than a rule.
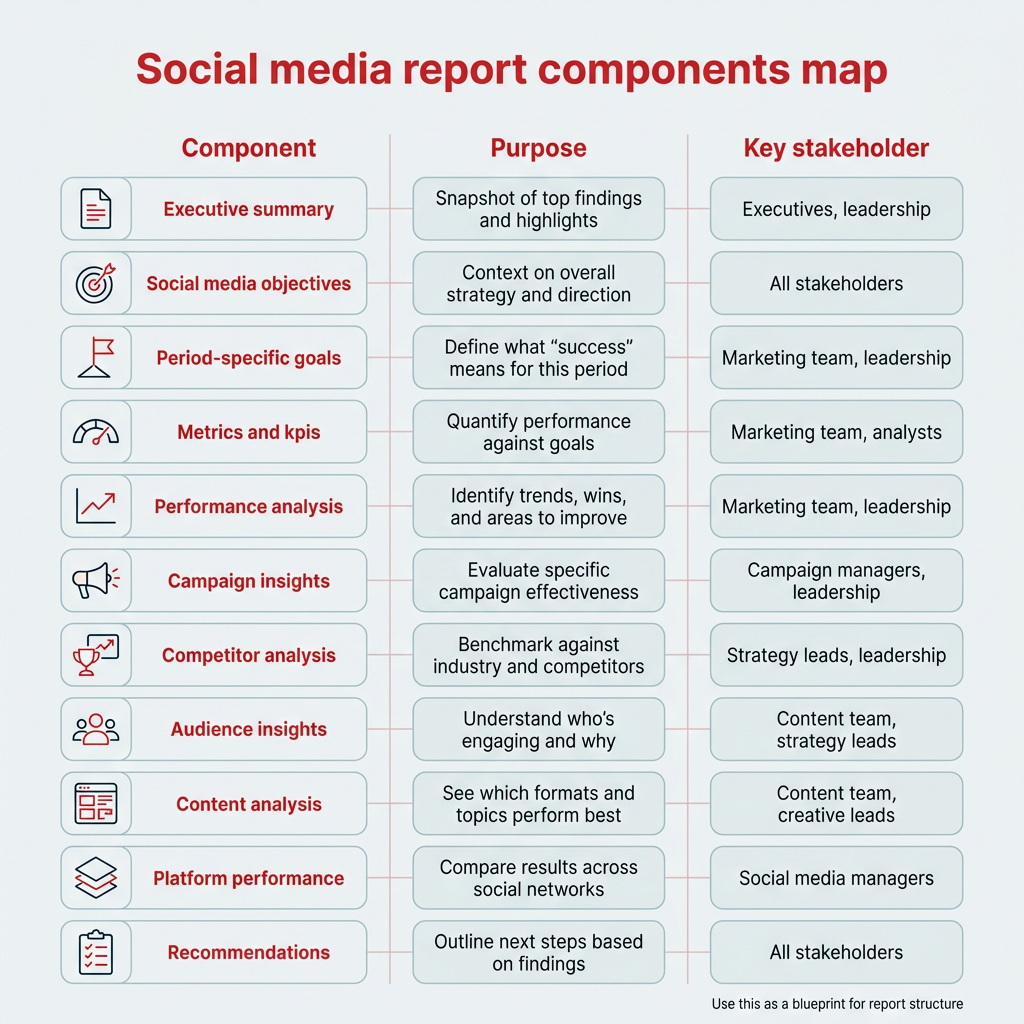
Here’s a quick overview of how each component fits into the bigger picture:
Component | Purpose | Key stakeholder |
|---|---|---|
Executive summary | Snapshot of top findings and highlights | Executives, leadership |
Social media objectives | Context on overall strategy and direction | All stakeholders |
Period-specific goals | Define what “success” means for this period | Marketing team, leadership |
Metrics and KPIs | Quantify performance against goals | Marketing team, analysts |
Performance analysis | Identify trends, wins, and areas to improve | Marketing team, leadership |
Campaign insights | Evaluate specific campaign effectiveness | Campaign managers, leadership |
Competitor analysis | Benchmark against industry and competitors | Strategy leads, leadership |
Audience insights | Understand who’s engaging and why | Content team, strategy leads |
Content analysis | See which formats and topics perform best | Content team, creative leads |
Platform performance | Compare results across social networks | Social media managers |
Recommendations | Outline next steps based on findings | All stakeholders |
Executive summary
Many social media reports start with a brief overview of the report’s findings and highlights. This is a snapshot of your social media performance — a few sentences that summarize the details that are covered later in the report.
Social media objectives
A quick overview of your social media strategy provides context, reminding readers of what you’re trying to accomplish. Does your company use social primarily as a channel for customer service? Social commerce? Brand awareness? All of the above?
Be sure to highlight any changes in strategy since the last time you reported, including any new channels you’ve incorporated into your social mix.
Period-specific goals
Outline the goals you were hoping to accomplish during the reporting period — whether it’s audience growth or gathering insights from social listening. This lets everyone reading the report understand what “success” specifically means.
Metrics and KPIs
Present the social media KPIs that you’re tracking. It probably goes without saying, but these metrics should align with your goals (above). Specific metrics you might want to highlight include engagement, click-through rate (CTR), reach, followers, website clicks, or conversion rates.
Performance analysis
This is what most people are interested in. To analyze your performance, you’ll want to review how your metrics and KPIs stack up against your stated goal. Identify trends, successes, and areas that need improvement.
Campaign insights
If you ran specific campaigns over the reporting period, create a separate segment to share insights about their performance. What worked well? What could be tweaked for next time?
Competitor analysis
Consider including a competitive analysis to benchmark your performance against other brands in the industry.
At this point, you probably have a sense of how your accounts have grown or changed over the weeks or months, but comparing your performance to your peers can provide some interesting insight as well.
Audience insights
Share up-to-date demographic information about your target audience. Who are your followers? Where are they from? How old are they? What else do we know about their interests and behavior?
Understanding who is consuming your content allows you to tweak your content strategy accordingly.
Content analysis
There may be interesting insights to glean from the type of social media content that’s trending (or underperforming). Evaluate the performance of different types of content — text, images, videos, and so on.
Identify which content resonated the most with your audience.
Platform performance
If you’re active on multiple platforms, assess the performance of each one in this section. Different social networks may require unique strategies — 84% of U.S. adults use YouTube while only 50% use Instagram, so your TikTok stats and your Instagram stats could tell two totally different stories.
Recommendations
Based on your analysis and findings, suggest actionable recommendations for future campaigns or the next reporting period.
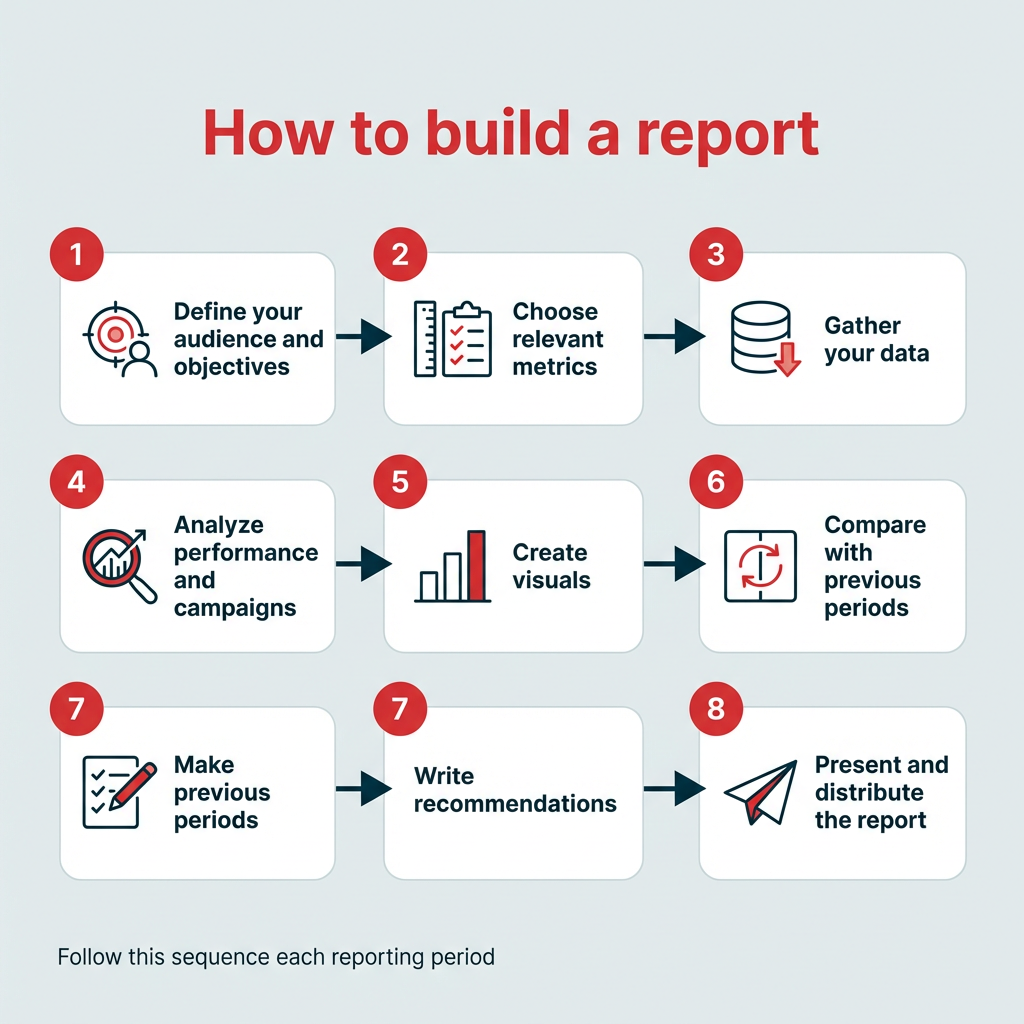
Creating a social media report involves setting goals, selecting the right metrics, analyzing performance data, and then presenting next steps. At a high level, the process looks like this:
- Define your audience and objectives
- Choose relevant metrics
- Gather your data
- Analyze performance and campaigns
- Create visuals
- Compare with previous periods
- Write recommendations
- Present and distribute the report
Step 1: Define your audience and objectives
Is the social media report for the sales team, or to get the new marketing interns up to speed? Is it for shareholders? Are you sharing this with the general public?
Understanding who is reading the report will help shape what information goes in it — and sometimes, less is more.
Once you know your audience, define the objectives you want to achieve through your social media efforts. Then, break that down into smaller, more time-specific goals.
It’s a good idea to use the SMART goal-setting framework, which helps you create goals that are easier to track and report.
To make sure your goals are realistic, base them on benchmarks specific to your industry and the social platforms you’re active on.
For example, knowing that the average Instagram engagement rate in financial services is 5% will put your past performance and future goals in perspective…
… as will knowing the follower growth rate:
Step 2: Choose relevant metrics
Once you’ve settled on your goals, it’s time to decide just how you’ll measure your progress towards them.
For instance, if your goal is to reach a younger demographic, increasing your follower count on TikTok could be a great objective — and that’s an easy metric to track.
The metrics that matter will be different for every marketing team, but some key overall metrics to include are:
- Number of leads generated
- Number of conversions
- Total revenue generated
- Total return on investment (ROI)
- Total spend on social ads
- Social share of voice
- Social sentiment
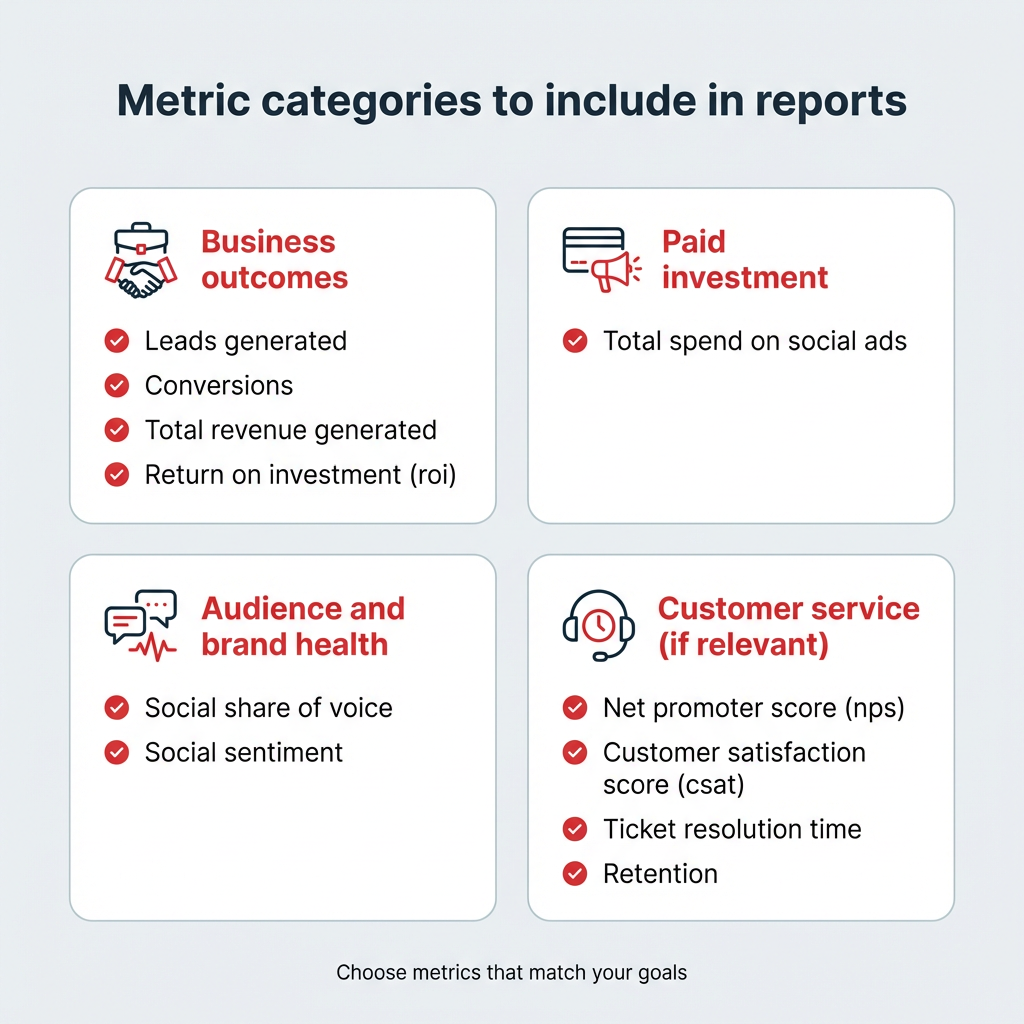
If you’re using social media for customer service, it’s also a good idea to report on service metrics like net promoter score (NPS), customer satisfaction score (CSAT), ticket resolution time, and retention.
For a full breakdown of all the numbers you can include in your social media business report, check out our post on the social media metrics that really matter.
Step 3: Gather your data
Collect data for the reporting period. Most social media platforms offer built-in analytics, but you can also use a third-party tool for a more comprehensive analysis, like Hootsuite Listening.
If it makes sense for your team, you can get even more specific and break things down by format, such as Stories vs. posts vs. Reels.
No matter what metrics you choose, include data from previous weeks, months, or years so you can compare your performance later in the report. After all, data means nothing in a vacuum.
Step 4: Analyze performance and campaigns
Now it’s time to analyze your performance and form conclusions or insights.
What can you learn from your top-performing posts? What content and strategies contributed most to your success, and which underperformed?
It’s also important to look beyond quantitative metrics. Maybe you made contact with a key social media influencer for the first time. Or, maybe a compelling review came in through social that you can use in future marketing campaigns.
As part of your analysis, pull information about your audience demographics, interests, and behaviors. Who is your average follower at this specific moment in time? When are they online, and what do they do there?
You’ll also want to pull some recent data about your competitors and industry — where are companies thriving or struggling? This info can help you benchmark your own performance.
If you ran specific campaigns during the reporting period, evaluate those separately too. Did your ad blitz totally falter on Facebook, but thrive on Pinterest? Determine what aspects led to success and what can be improved in future campaigns.
Include room in your social media report to share all forms of success that are relevant to your goals.
Beautiful reports. Clear data. Actionable insights to help you grow faster.
Start your free trialStep 5: Create visuals
Visualize your data using graphs, charts, and tables.
Visuals make it easier to understand complex information and trends at a glance. Google Sheets can quickly generate charts and visuals, and Canva is another easy design tool to use.
Step 6: Compare with previous periods
At this stage, you’re looking at how current results stack up against previous reporting periods, like last month, last quarter, or the same time last year.
Comparing performance side by side helps you spot trends and understand where you’ve improved (or, gulp, regressed). It also adds important context, helping you account for seasonality, campaign cycles, or changes in audience behavior.
For example, a dip in engagement during the summer might reflect a predictable slowdown rather than a problem with your content or strategy.
Step 7: Write recommendations
Now that you’ve soaked up all this data, it’s time to make some educated suggestions on what should happen next.
Does your team need to invest in some targeted social ads to improve your reach? Should you double down on creating TikTok videos?
Provide actionable recommendations for future campaigns, whether that means suggesting content ideas or adjusting posting schedules. Tie each recommendation to a specific data point from the report so stakeholders can see exactly what’s driving the suggestion.
Step 8: Present and distribute the report
The final step is getting the report into the right hands, in the right format.
Consider how your audience prefers to consume information. Executives may want a concise PDF or a slide deck they can skim in five minutes. Your social team might prefer a live dashboard they can check anytime. For cross-functional stakeholders, a scheduled email summary with a link to the full report often works well.
Whatever format you choose, set a consistent distribution cadence so stakeholders know when to expect updates. Consistency builds trust and keeps social performance top of mind across the organization.
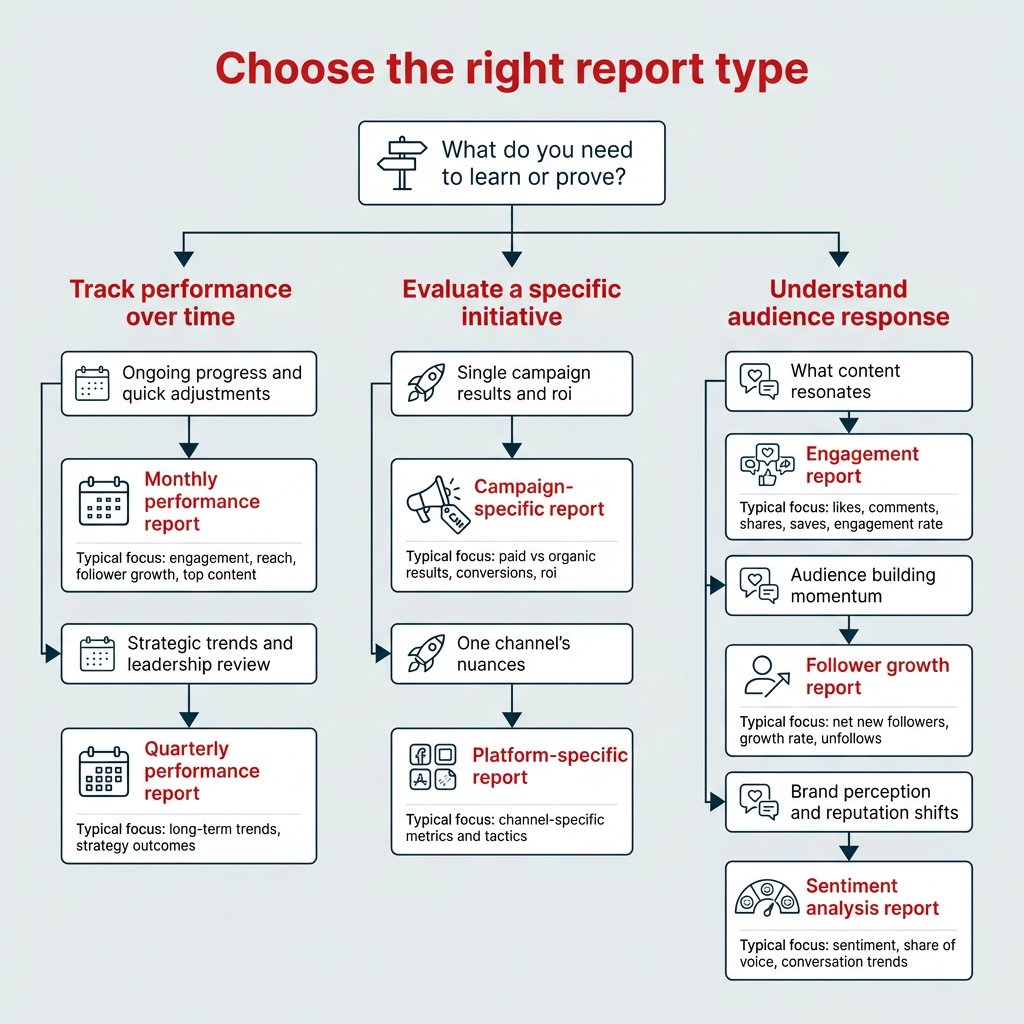
There are several types of social media reports, each designed for a different purpose. Here are some of the most common:
- Monthly performance reports
- Quarterly performance reports
- Campaign-specific reports
- Platform-specific reports
- Engagement reports
- Follower growth reports
- Sentiment analysis reports
Monthly performance reports
As you might’ve guessed from the name, monthly social media reports provide a snapshot of your performance over a month. They are useful for tracking short-term goals, and allow you to make adjustments to strategy in real-time. Key metrics to track monthly include engagement rate, reach, follower growth, and top-performing content.
Quarterly performance reports
Quarterly reports offer a more comprehensive analysis of your performance over a quarter. These types of social media reports provide a broader perspective and help your team identify long-term trends. They’re also ideal for executive and board-level presentations, since they offer enough data to show meaningful progress without getting lost in week-to-week noise.
Campaign-specific reports
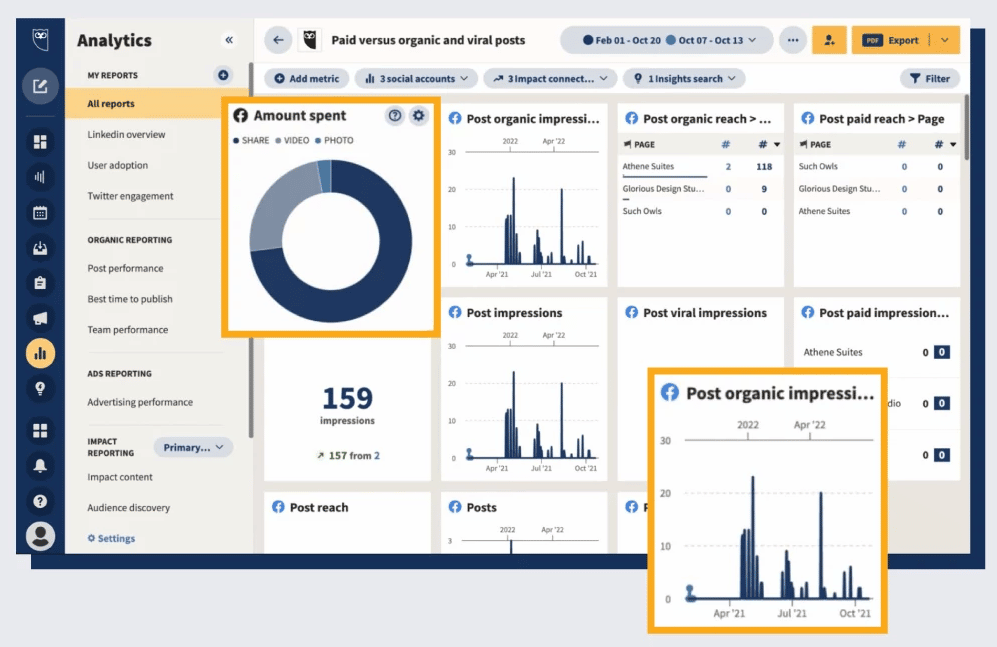
It’s a good idea to report on and track campaign metrics in your broader social media reports, but you might find it useful to create a dedicated campaign report. With a hyper-focused review like this, you’ll be able to offer detailed insights into its success and areas for improvement. Consider comparing paid vs. organic performance within the same campaign to see where your budget had the most impact.
Platform-specific reports
Each social media platform has its own unique dynamic, so you may find it tricky to review the nuances in one generalized report. That’s where platform-specific social media reports come in. For businesses active on multiple platforms, creating platform-specific reports allows you to tailor your analysis more precisely.
Engagement reports
An engagement report zeroes in on how your audience interacts with your content: likes, comments, shares, saves, and overall engagement rate across platforms. This type of social media analytics report is especially useful for content teams evaluating what resonates and what falls flat. Track engagement by format (video vs. static vs. carousel) to spot patterns you can act on.
Follower growth reports
A follower growth report tracks net new followers, growth rate, and unfollows over time. It’s a straightforward way to measure brand awareness and audience-building efforts. Comparing growth rates across platforms can reveal where your brand is gaining traction and where you may need to adjust your approach.
Sentiment analysis reports
Sentiment analysis reports go beyond the numbers to capture how people feel about your brand. They cover brand sentiment, share of voice, and conversation trends across social channels. This type of report is especially valuable for reputation management and crisis monitoring, helping teams catch shifts in public perception early.
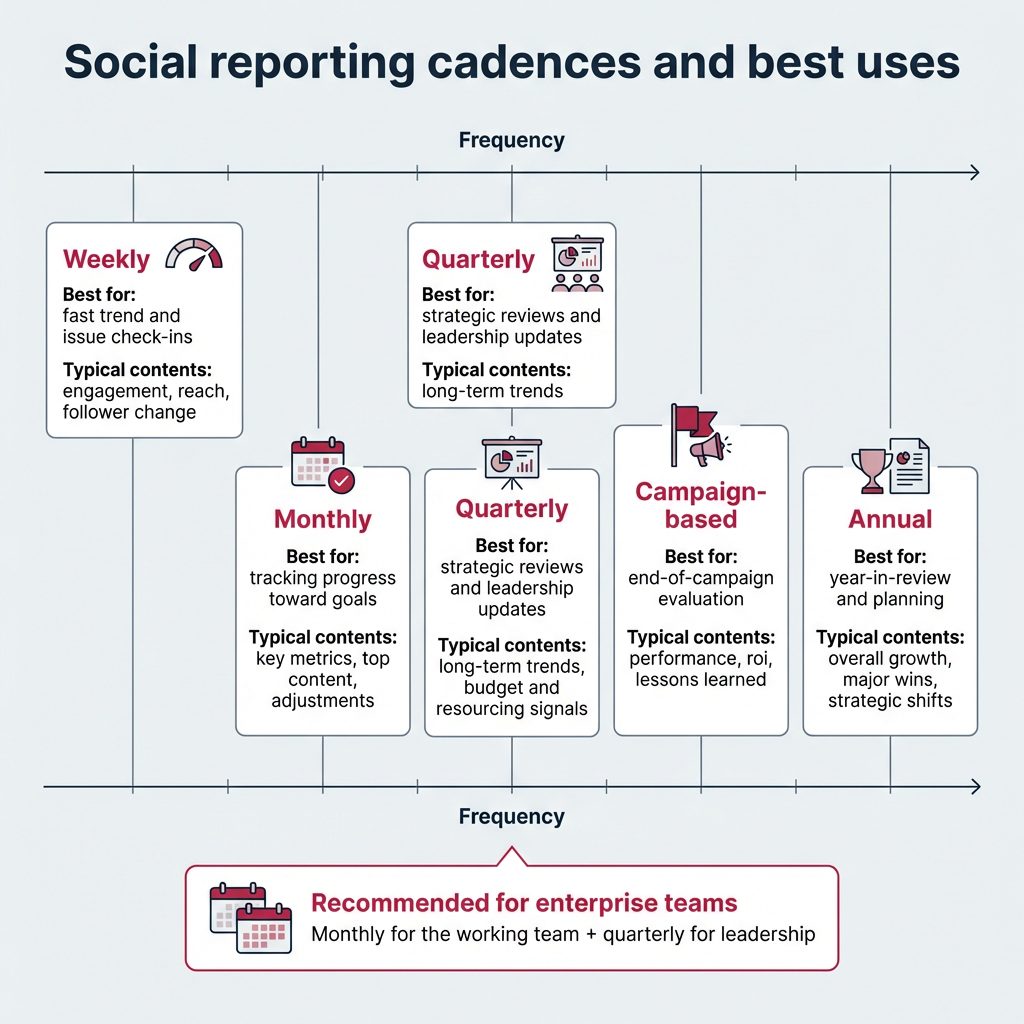
The right reporting cadence depends on your team’s goals and how quickly you need to act on insights. Most enterprise teams use a combination of frequencies to stay both responsive and strategic.
Here are the most common cadences:
- Weekly: Quick check-ins on key metrics like engagement, reach, and follower changes. Useful for social teams who need to spot issues or capitalize on trends fast
- Monthly: The most common cadence for social media reporting. Monthly reports track progress toward goals, highlight top content, and flag areas for adjustment
- Quarterly: Best for strategic reviews and leadership presentations. Quarterly reports reveal longer-term trends and help inform budget and resource decisions
- Campaign-based: Created at the end of a specific campaign to evaluate performance, ROI, and lessons learned. Timing varies based on campaign length
- Annual: A year-in-review report that summarizes overall growth, major wins, and strategic shifts. Useful for annual planning and executive briefings
Most enterprise teams find that a monthly report for the working team, paired with a quarterly report for leadership, covers the majority of their social media reporting needs.
You can create social media reports using in-platform analytics and third-party reporting tools.
Many teams use a mix of:
- In-platform analytics
- Social media management tools, and
- Web analytics tools
The right tool depends on your reporting needs, scale, and level of detail. Here’s how the three main types compare:
Tool type | Pros | Cons | Best for |
|---|---|---|---|
In-platform analytics (e.g., Meta Business Suite, TikTok Analytics) | Free, native data, real-time | Siloed by platform, no cross-channel view | Single-platform reporting |
All-in-one management tools (e.g., Hootsuite Analytics) | Cross-platform data, custom reports, benchmarks, automation | Requires subscription | Enterprise and multi-platform teams |
Web analytics (e.g., Google Analytics) | Tracks social traffic to website, conversion data | Doesn’t track on-platform social metrics | Measuring social’s impact on web traffic and conversions |
Here are some of the best tools available:
1. In-platform analytics tools
Whether you’re diving into your Instagram numbers or your LinkedIn data, social media platforms feature an in-house analytics platform that will shed light on your performance.
Learn more about each of the social media platforms’ analytics tools here:
2. Hootsuite Analytics
Hootsuite Analytics is a social media analytics tool that lets you easily track the performance of all your social channels in one place, including Facebook, Instagram, X (formerly Twitter), LinkedIn, TikTok, and Bluesky.
The tool also makes it easy to create custom reports to showcase your results to your boss and share insights with your team.
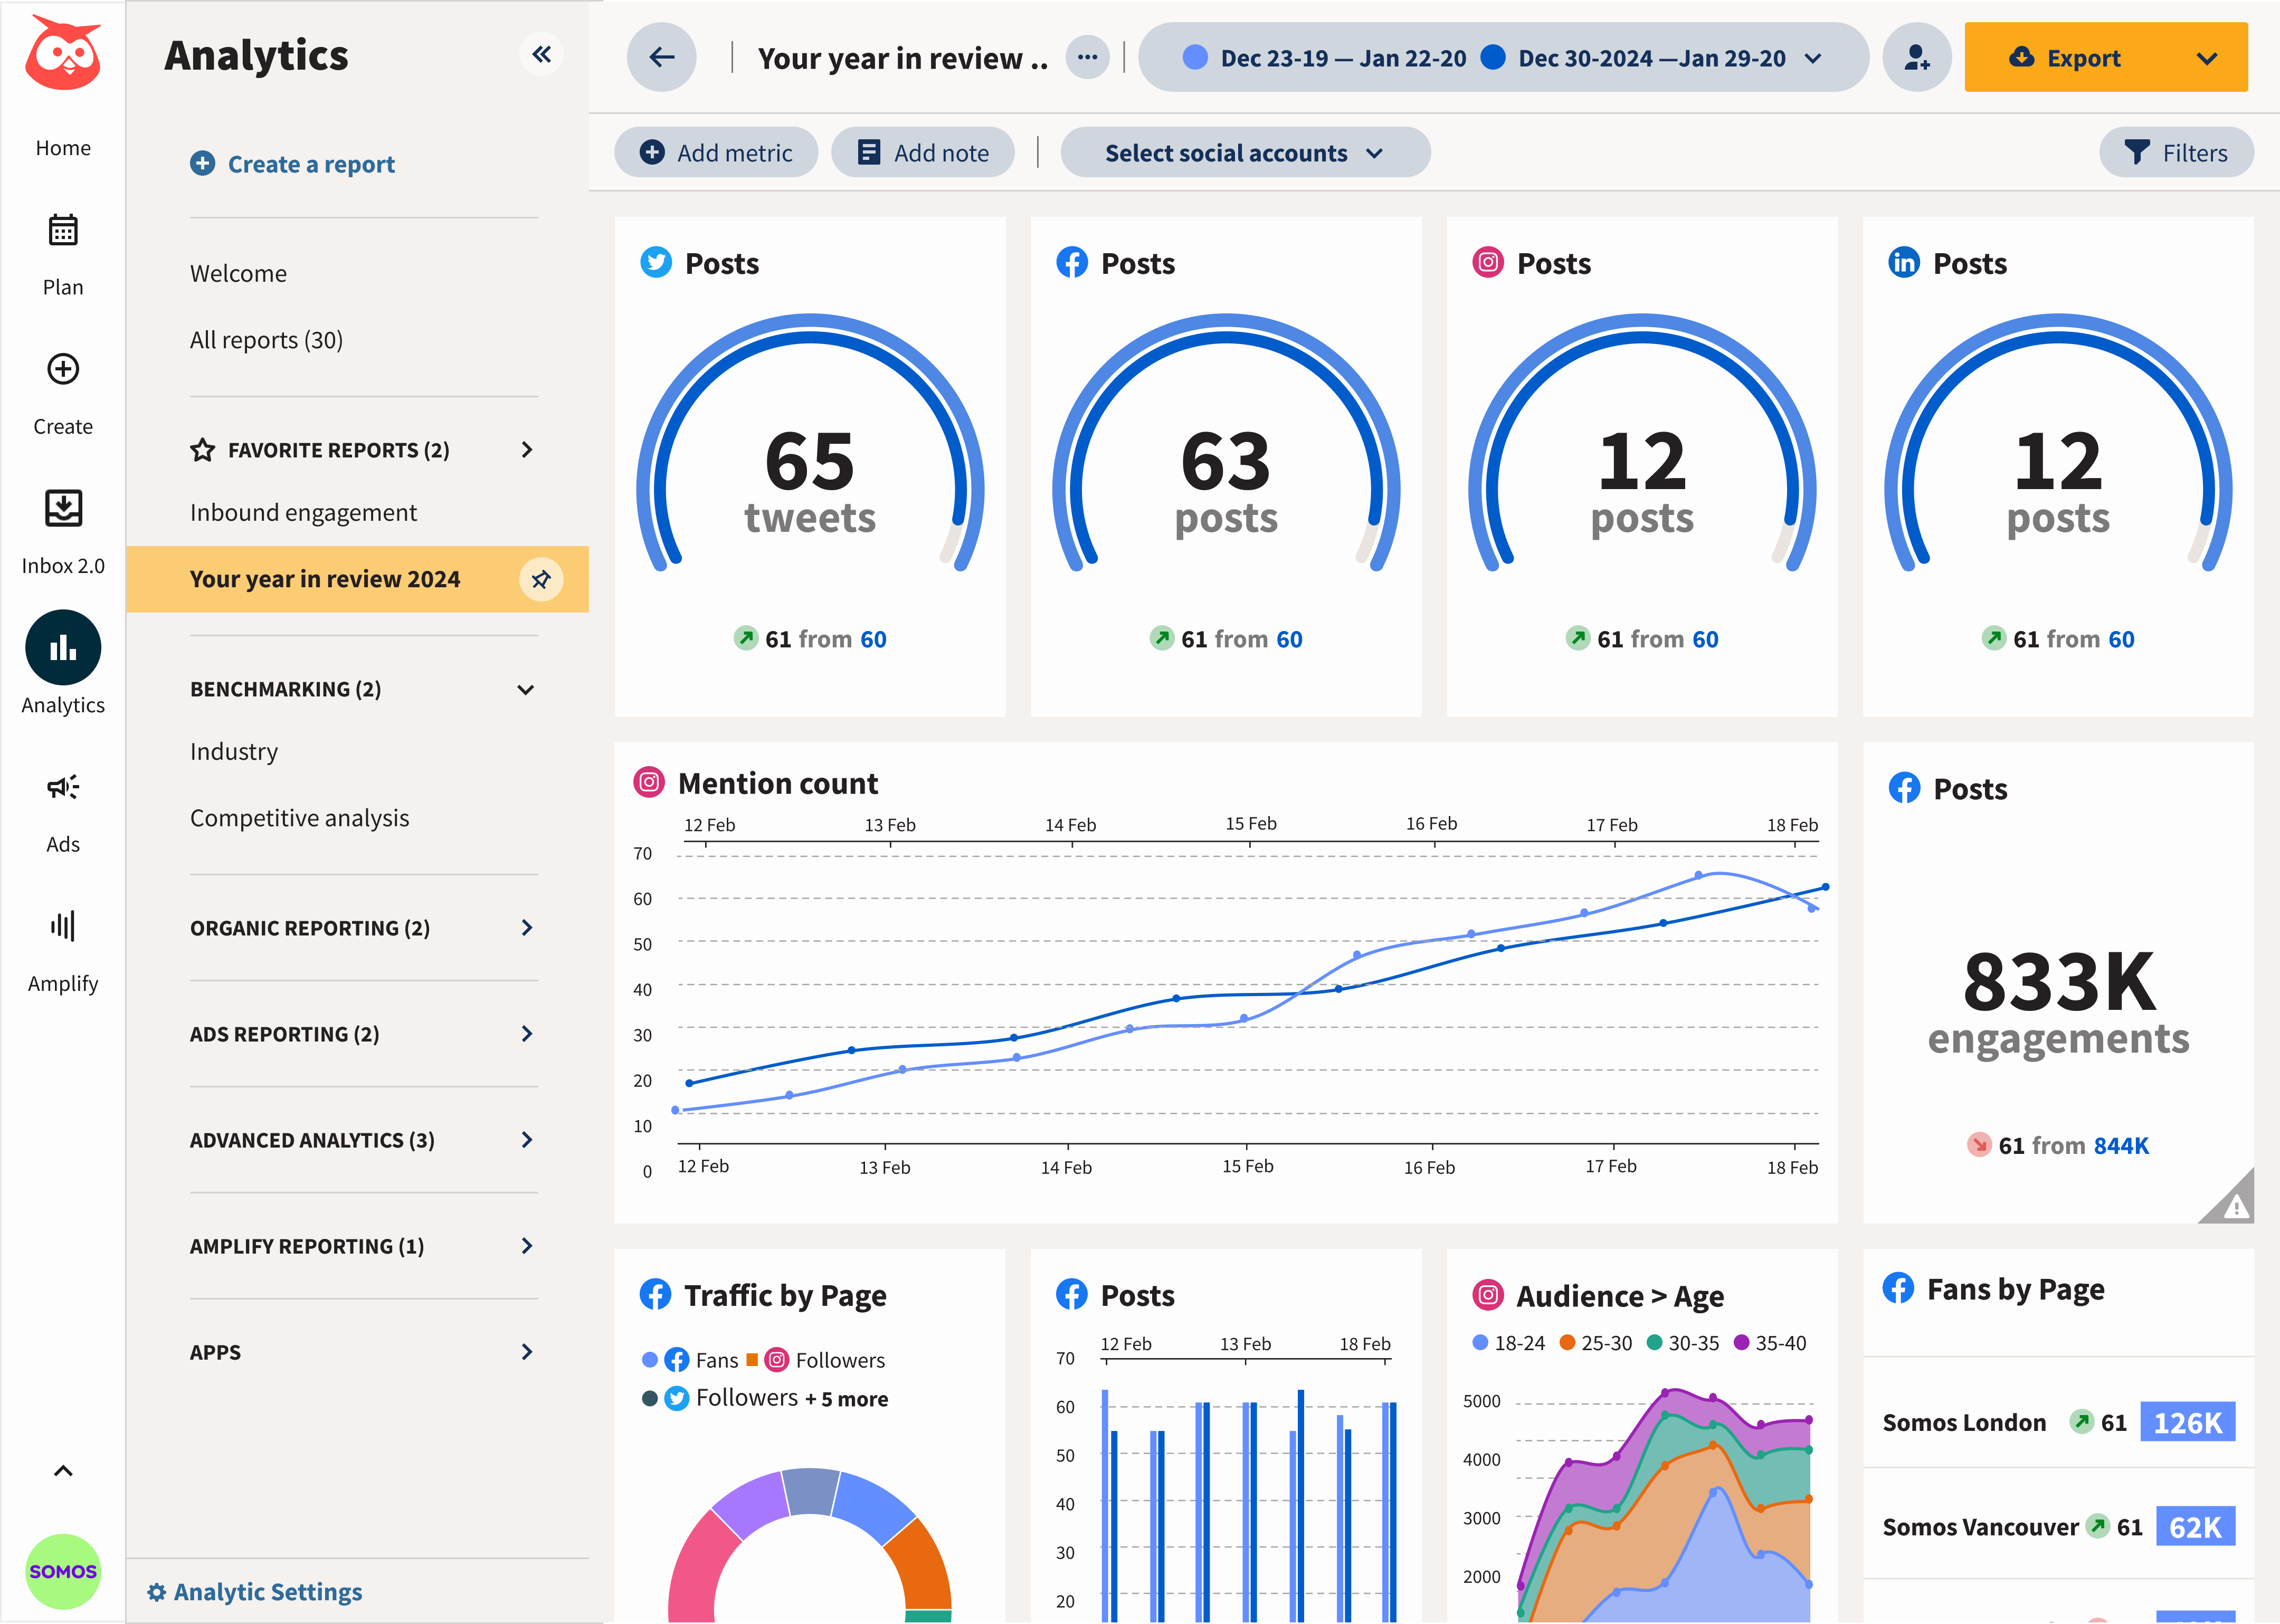
From a single dashboard, you can track metrics across key categories:
- Engagement: Likes, comments, shares, saves, reactions, clicks
- Reach and impressions: Page and profile reach, impressions, video views
- Audience: New followers, total followers, profile visits, daily engaged users
- Content performance: Average time watched, engagement rate, negative feedback rate
For a full list of available metrics, see the Hootsuite Analytics metrics guide.
You can set up custom boards that give you an overview of your most important metrics at a glance, or dive into more granular information, down to individual post performance.
With Hootsuite Analytics, you can also:
- Find out when your audience is online
- Get personalized recommendations for your best times to post for each of your accounts
- Easily view industry benchmarks and see how you compare to competitors
3. Talkwalker
Talkwalker leads the industry in social data intelligence, making it a strong fit for teams that need to report on brand sentiment, share of voice, and competitive positioning.
The platform uses AI to surface actionable insights from real-time social media monitoring, helping you track conversation trends, detect emerging topics, and build sentiment analysis reports. It’s especially useful for enterprise teams managing reputation across multiple markets or regions.
4. Google Analytics
Google Analytics (GA4) is a powerful web analytics tool that provides valuable insights into website and app performance, including how social media drives traffic and conversions.
It’s widely used by businesses and marketers to track user interactions, analyze traffic sources, and measure the downstream impact of social media efforts on website behavior and goals.
5. Panoramiq Insights
Seamlessly integrating with Hootsuite, Panoramiq Insights allows you to conveniently access crucial Instagram metrics directly from your dashboard.
The tool offers comprehensive analytics for your entire range of Instagram actions, spanning posts, Stories, and Reels. It also keeps a pulse on user information, from follower demographics to new follow interactions.
A solid structure gets you most of the way there, but a few habits can make the difference between a report that gets skimmed and one that drives action.
- Lead with insights, not just data. Don’t make your audience dig for the “so what.” Open each section with the key takeaway, then back it up with the numbers.
- Tailor depth to your audience. A C-suite reader needs a one-page summary with business impact. Your social team needs the granular breakdown. Build your report so both can get what they need.
- Always include benchmarks. Raw numbers lack context. Compare your results to previous periods, industry benchmarks, or competitor performance to show whether you’re ahead or behind.
- Automate what you can. Manual data pulls eat up hours every month. Use reporting tools to automate data collection and schedule recurring reports so you can spend more time on analysis.
- Use visuals to tell the story. A well-placed chart communicates a trend faster than a paragraph ever could. Prioritize graphs, tables, and screenshots over walls of text.
- End every report with next steps. Actionable recommendations are what turn a report from a status update into a strategic tool. Be specific about what should change and why.
Frequently asked questions
What is a social media report and what should it include?
How do you create a social media report for executives?
Which social media metrics matter most in enterprise reporting?
How often should enterprises create social media reports?
What tools help automate social media reporting?
How do you write a social media report?
What is the difference between social media analytics and social media reporting?
What should a monthly social media report look like?
How long should a social media report be?
Can you automate social media reports?
Save time managing your social media presence with Hootsuite. Publish and schedule posts, find relevant conversions, engage your audience, measure results, and more — all from one dashboard. Try it free today.